Why Your LinkedIn Impressions Dropped (and Whether You've Been Shadowbanned)
The platform-wide drop with its real sources, what a normal number of impressions looks like in 2026, the nine ordinary causes in the order to check them, and what LinkedIn has and has not said about shadowbans.

· 14 min read
On this page
Two things are true at once in October 2026. Reach on LinkedIn is lower for almost everyone than it was two years ago. And a drop on your own account almost certainly has an ordinary cause that you can find in ten minutes.
Most pages on this question blur the two. They open with a “reach is down 50%” figure that nobody sources, and close with a shadowban nobody has ever confirmed. People on r/linkedin asked the question three times in the week this was written. Here is the answer in the order to check, with LinkedIn’s own words at each step and the real sources for the platform-wide numbers.
The part that is not your fault
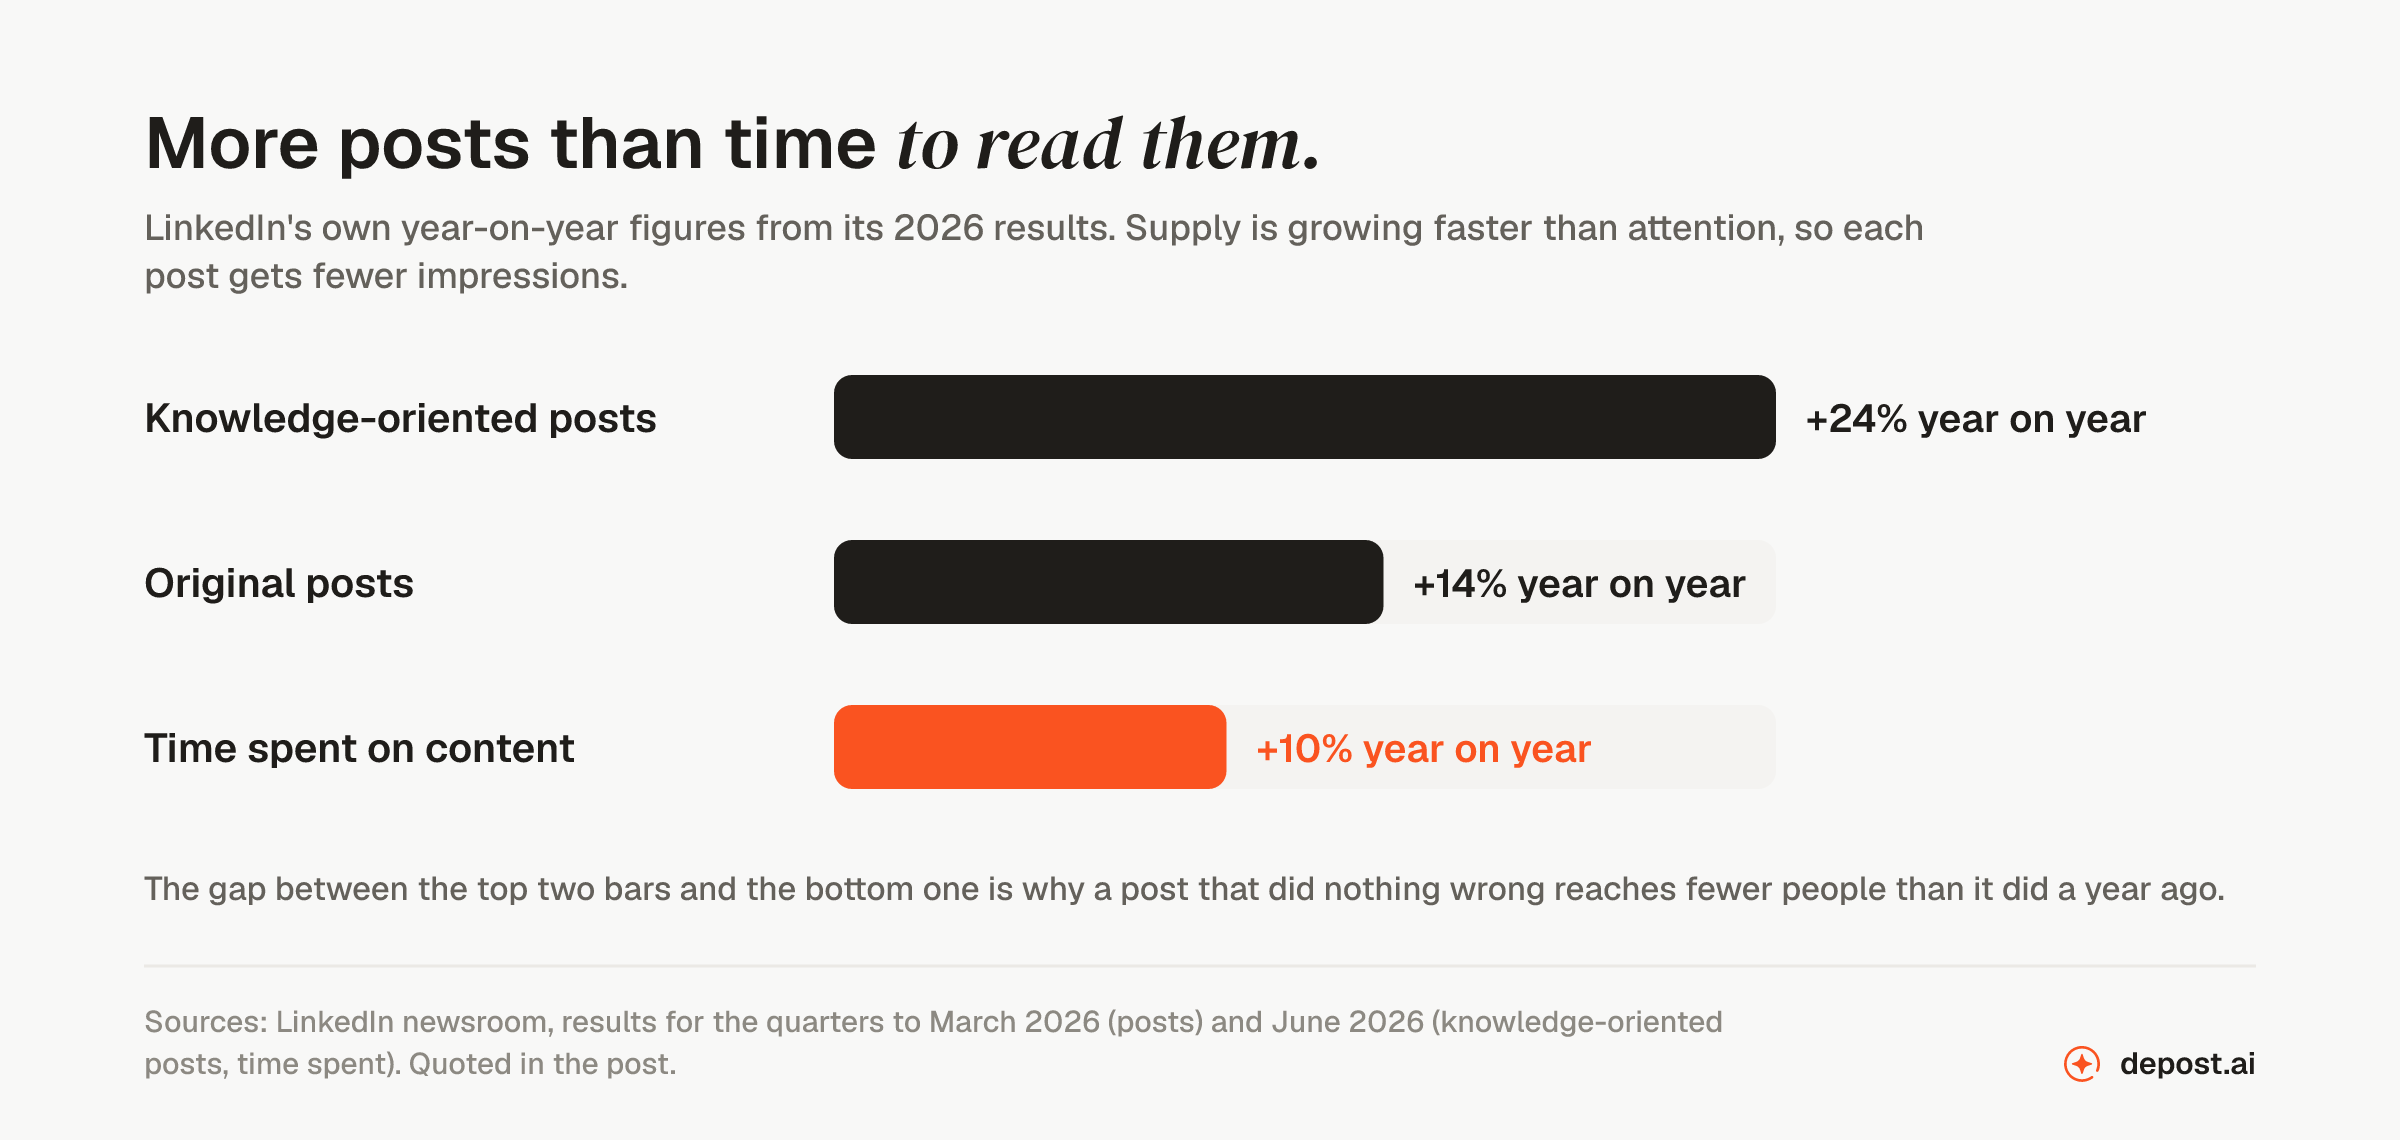
LinkedIn’s own figures show more posts than time to read them. In its results for the quarter to March 2026, LinkedIn said “original posts increased 14% year-over-year.” In the next quarter’s results it said “time spent on content grew 10% year over year” and “knowledge-oriented posts increased 24%.” Posts are growing faster than the attention available to read them. The arithmetic of that is fewer impressions per post, before anything about your writing changes.
The largest third-party study says the same thing, with a number. Richard van der Blom, whose team analyzed 1.3 million posts from 50,000 creators, said on the Creator Science podcast in June 2026: “reach is down 60% for active creators over the last two years.” He added: “Engagement is down 20, 25%.” Reach fell faster than engagement, which means the people who still see a post act on it more often. His report sells for €199 and we have not read it, so those are his spoken figures, not ours.
A monthly benchmark shows the slope. MagicPost, a scheduling tool, publishes a median every month from public posts. For September 2026, on 26,983 posts, the typical post got 572 impressions, “−6% in a month, −21% since October 2025.” A vendor’s sample, but a dated one, and it moves in the direction LinkedIn’s own figures predict.
The “50% drop” you have read elsewhere is this same evidence, passed along. Where the pages that quote it give any source at all, it is van der Blom’s 2025 report at second hand. The figures above are the ones with a date and a sample behind them.
What a normal number looks like
Before diagnosing a drop, know what you are comparing against. Three datasets published medians in 2026, and they disagree, which is itself the useful fact.
| Dataset | Sample | Median impressions per post |
|---|---|---|
| AuthoredUp, updated August 2026 | 476,465 personal-profile posts, September 2025 to February 2026 | about 840 |
| A 6,651-post set pulled through LinkedIn’s analytics API, October 2026 | 6,651 personal-profile posts | 581 |
| MagicPost, September 2026 | 26,983 public posts | 572 |
They differ because the samples differ. One is the users of a writing tool, one is accounts that connected an analytics tool, one is posts visible to the public. None is LinkedIn. All three say a post in the hundreds of impressions is a normal post in 2026, and a post over 1,000 is above most. AuthoredUp puts it precisely: 1,000 impressions “beat 56% of them,” and “the typical post earns its impressions alongside just 11 reactions and 2 comments at the median.”
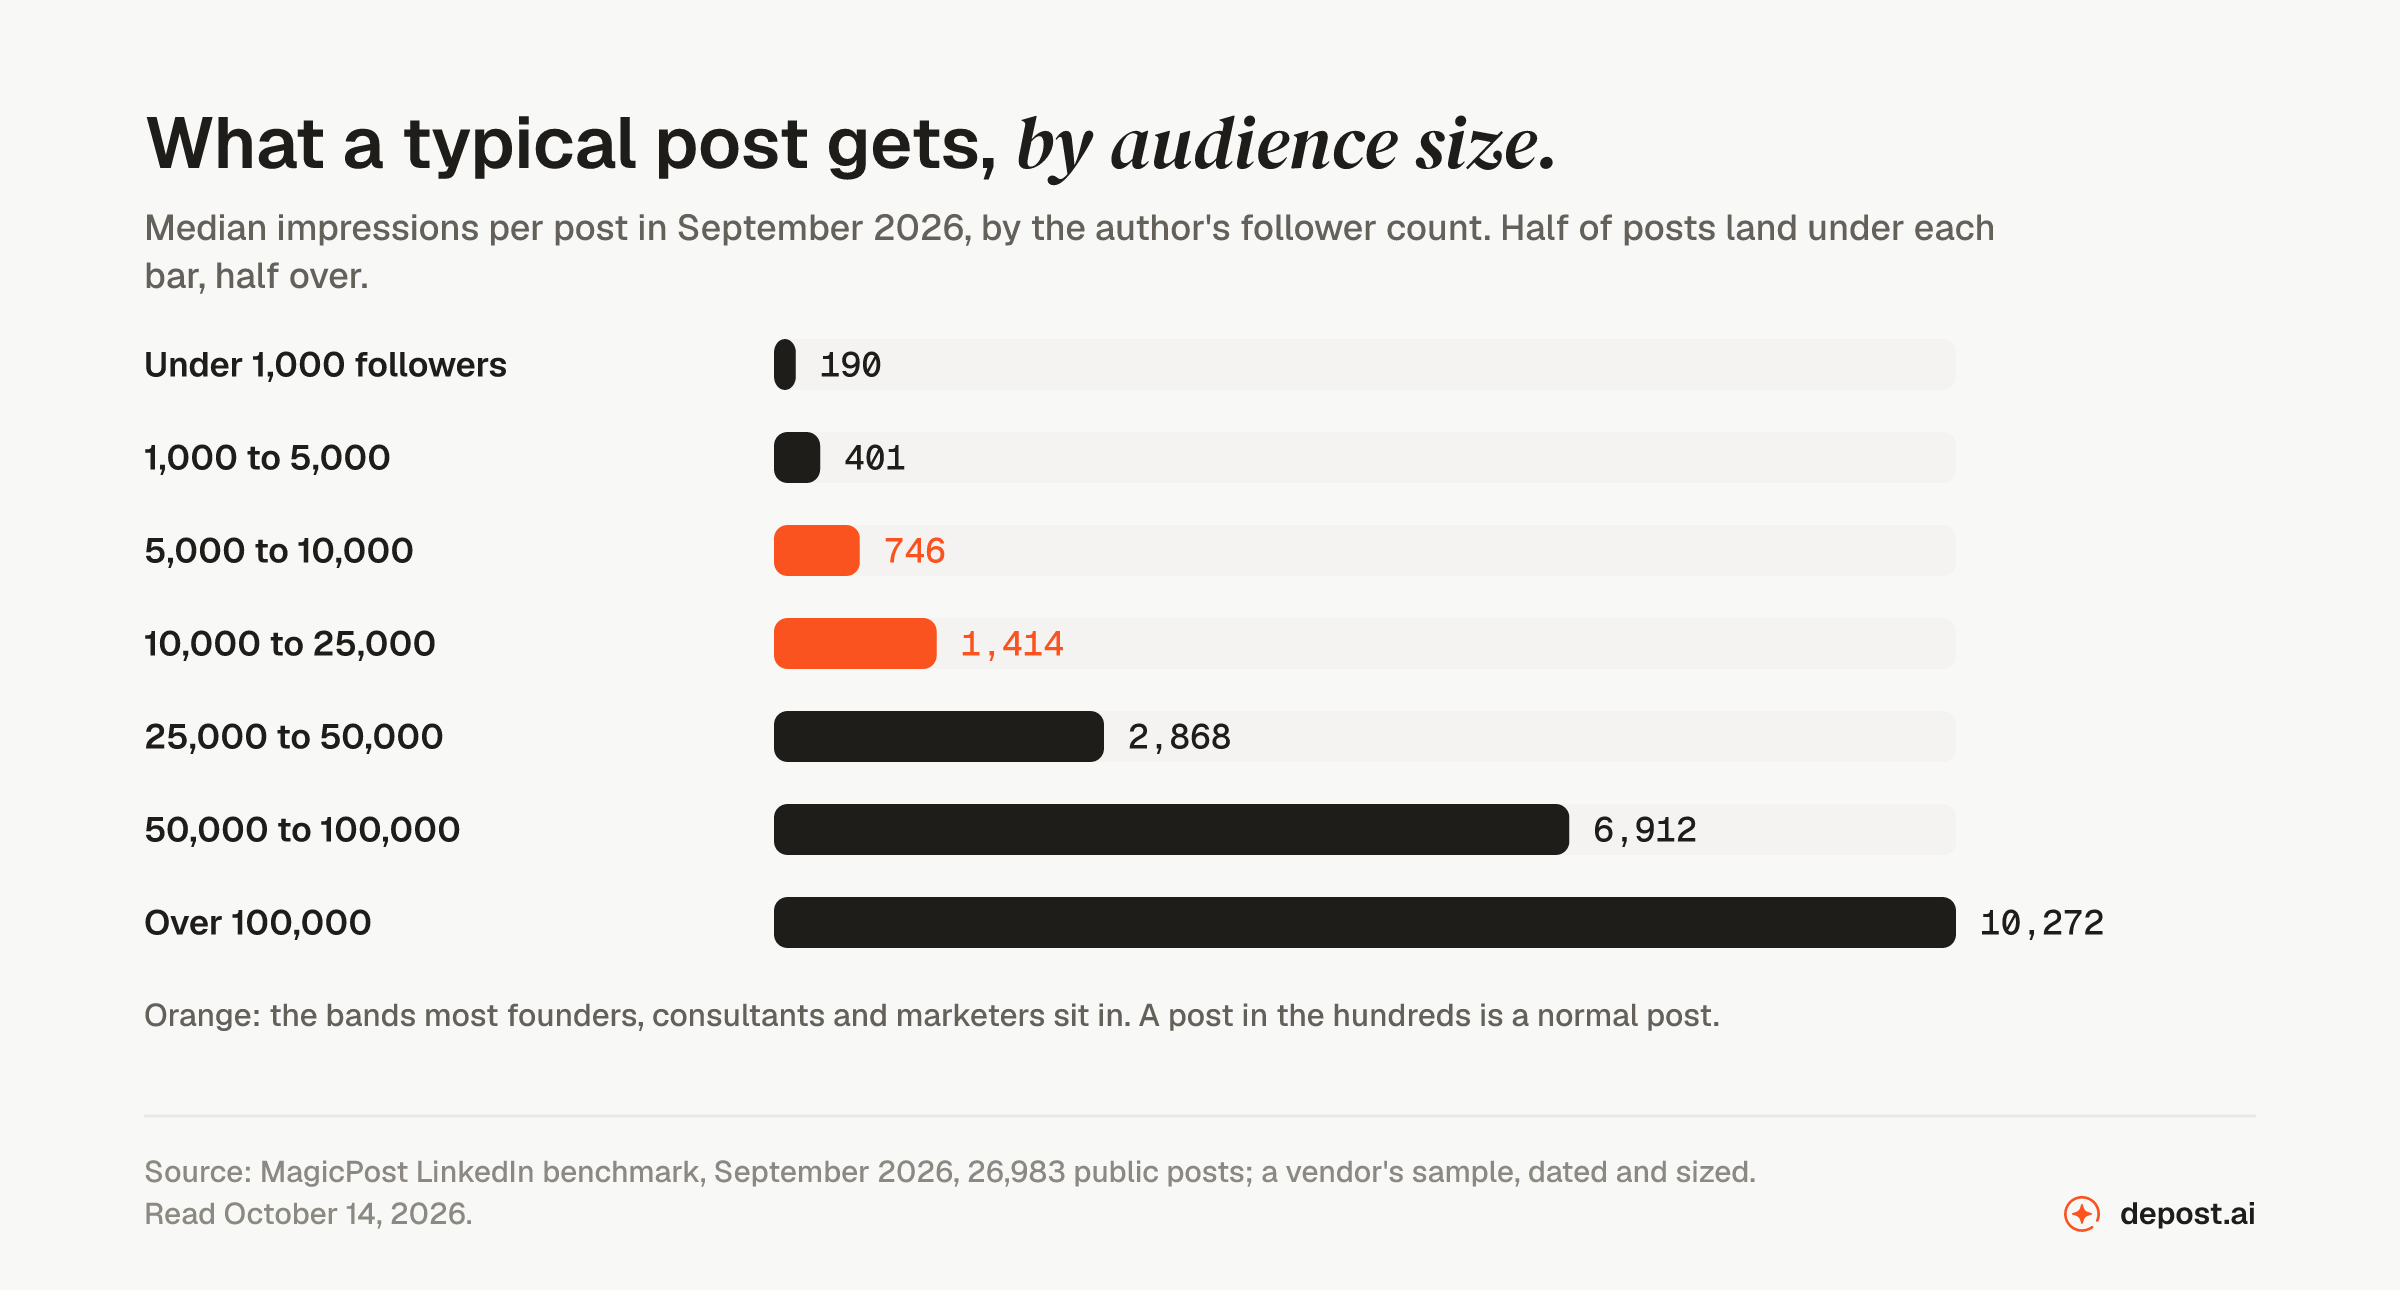
Audience size moves the number more than anything else. MagicPost’s September 2026 medians by follower count:
| Followers | Median impressions |
|---|---|
| Under 1,000 | 190 |
| 1,000 to 5,000 | 401 |
| 5,000 to 10,000 | 746 |
| 10,000 to 25,000 | 1,414 |
| 25,000 to 50,000 | 2,868 |
| 50,000 to 100,000 | 6,912 |
| Over 100,000 | 10,272 |
The 6,651-post set gives the same thing as a ratio: “the median post got impressions equal to 8% of the author’s follower count.” Two more numbers from these sets are worth keeping. The median post reached “46.5% as many unique people as it had impressions,” so about half of any impression count is the same people seeing a post again. And impressions are counted every time a post is shown, which LinkedIn’s own definition makes clear: “Number of times your post was shown on LinkedIn.”
None of those is your benchmark. Your benchmark is your own median. Take your last twenty posts, find the middle value for impressions, and compare the last five against it. A drop is a run of posts under your own median, not a post under someone else’s.
The checklist, in the order to look
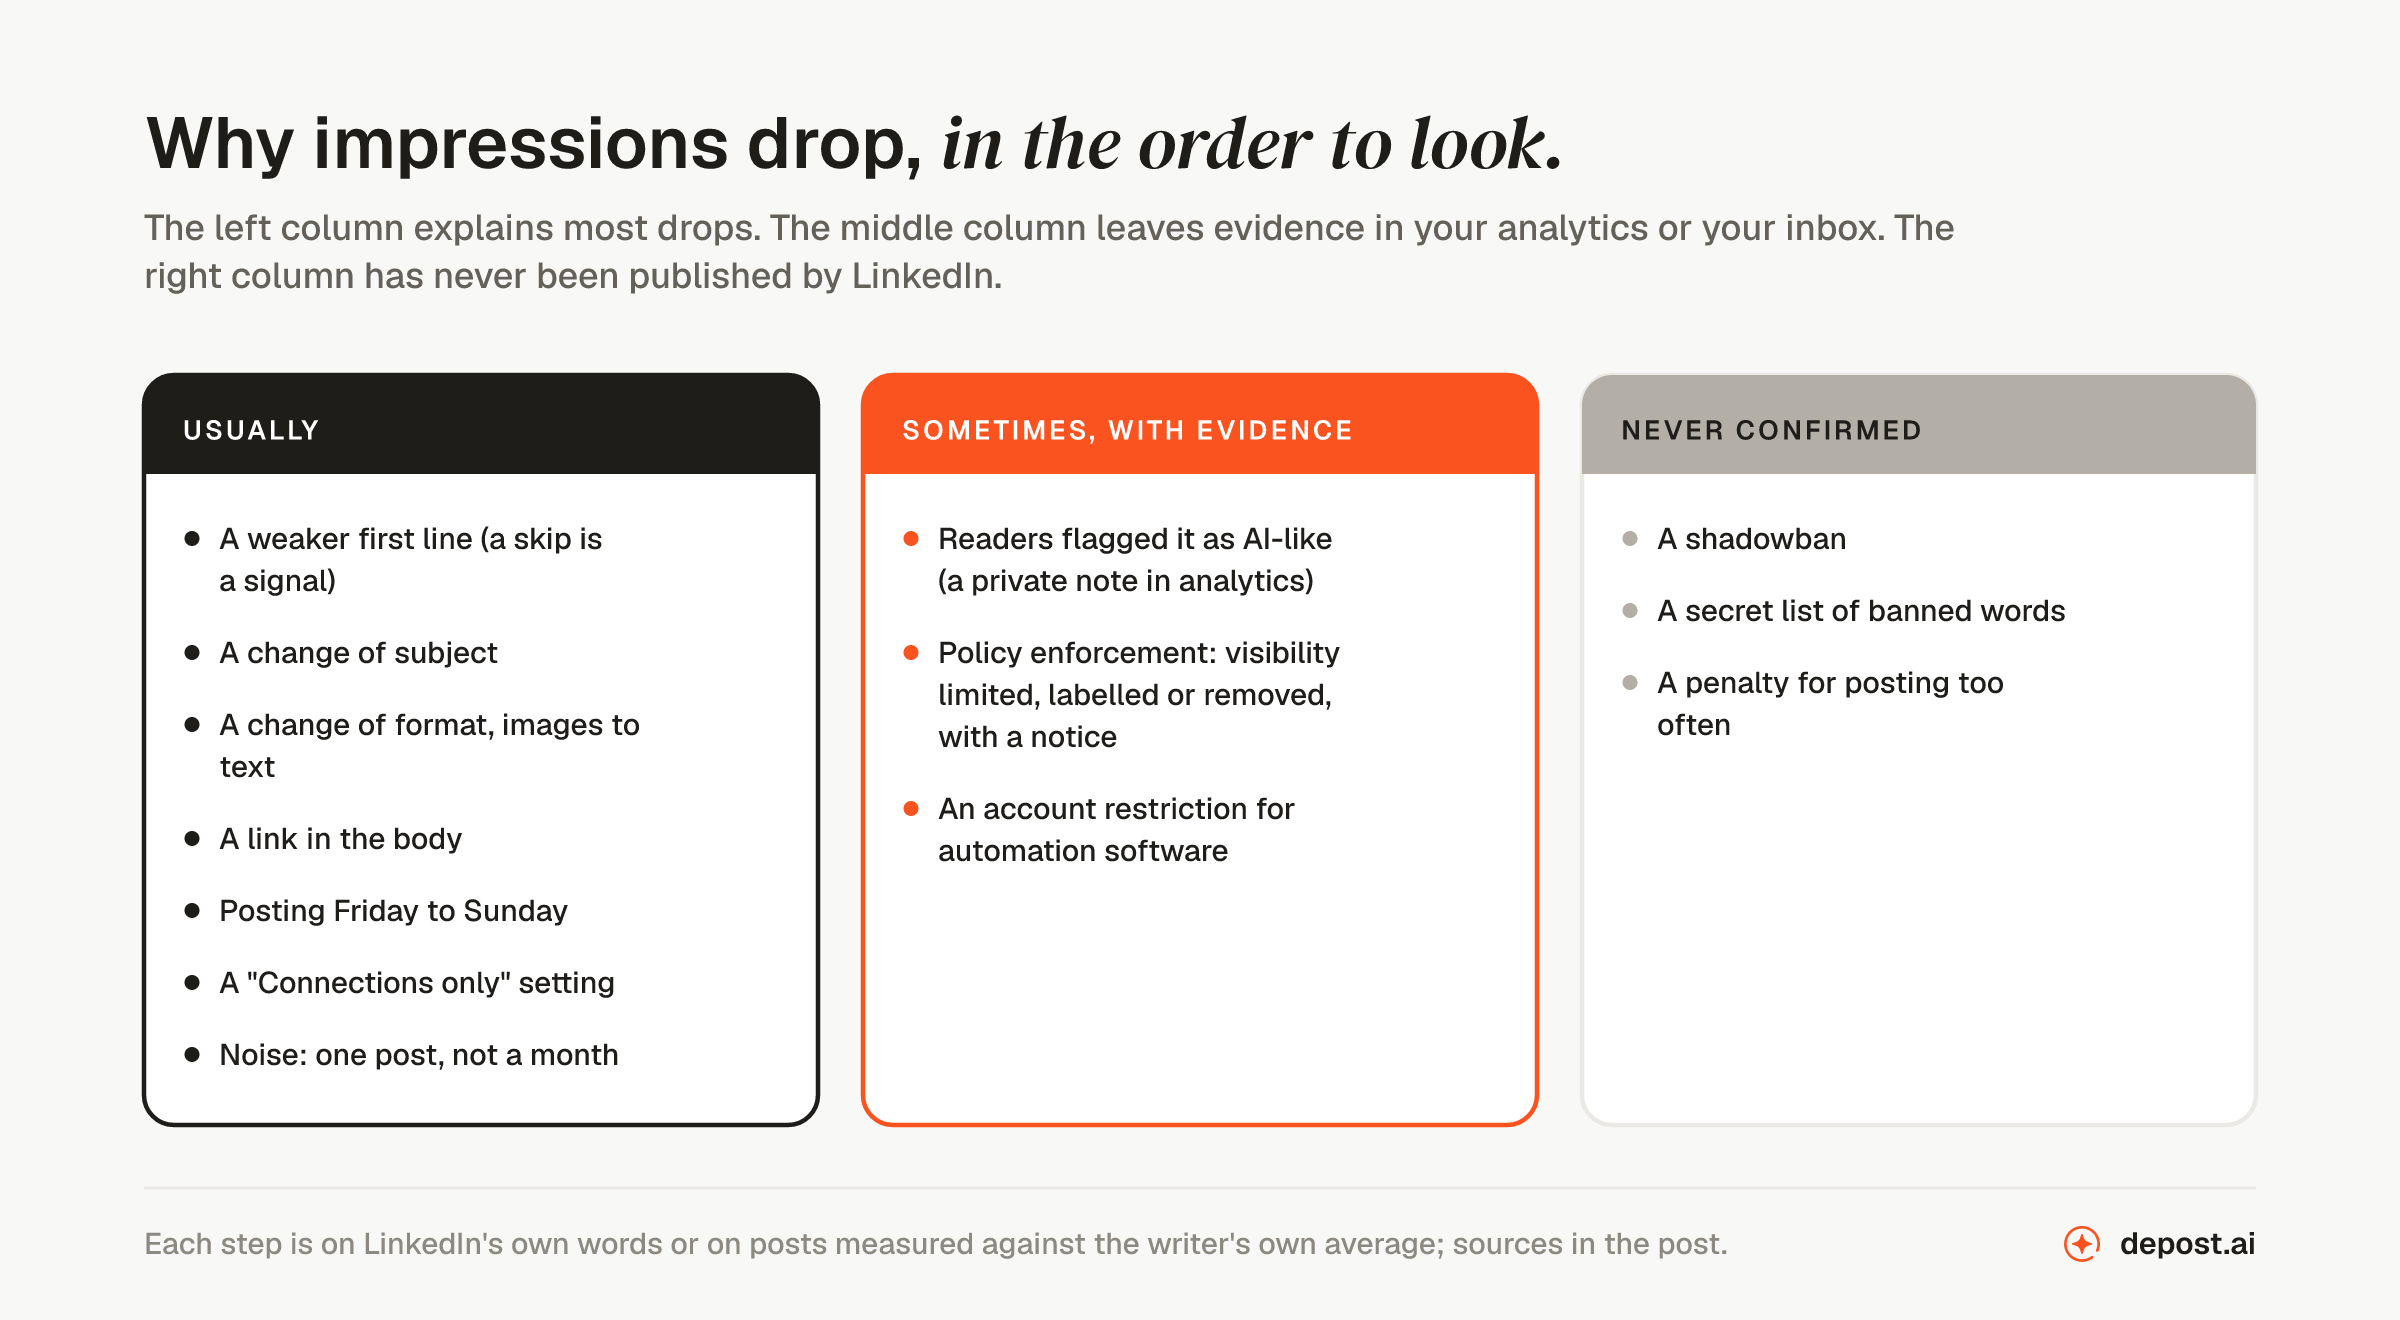
Nine causes. The first six are ordinary and account for most drops. The next two are rarer and come with their own evidence. The last is the one everybody suspects and nobody has confirmed.
1. Your first line stopped earning the click
Scrolling past a post is a signal, not an absence of one. LinkedIn’s engineering team, describing the feed it rebuilt in March 2026, said the ranking model trains on “passive tasks (click, skip, long-dwell) and active tasks (like, comment, share).” A weak opening line does not merely fail to earn “see more.” It feeds the system a skip from everyone who scrolls by. How the LinkedIn algorithm works in 2026 has the detail.
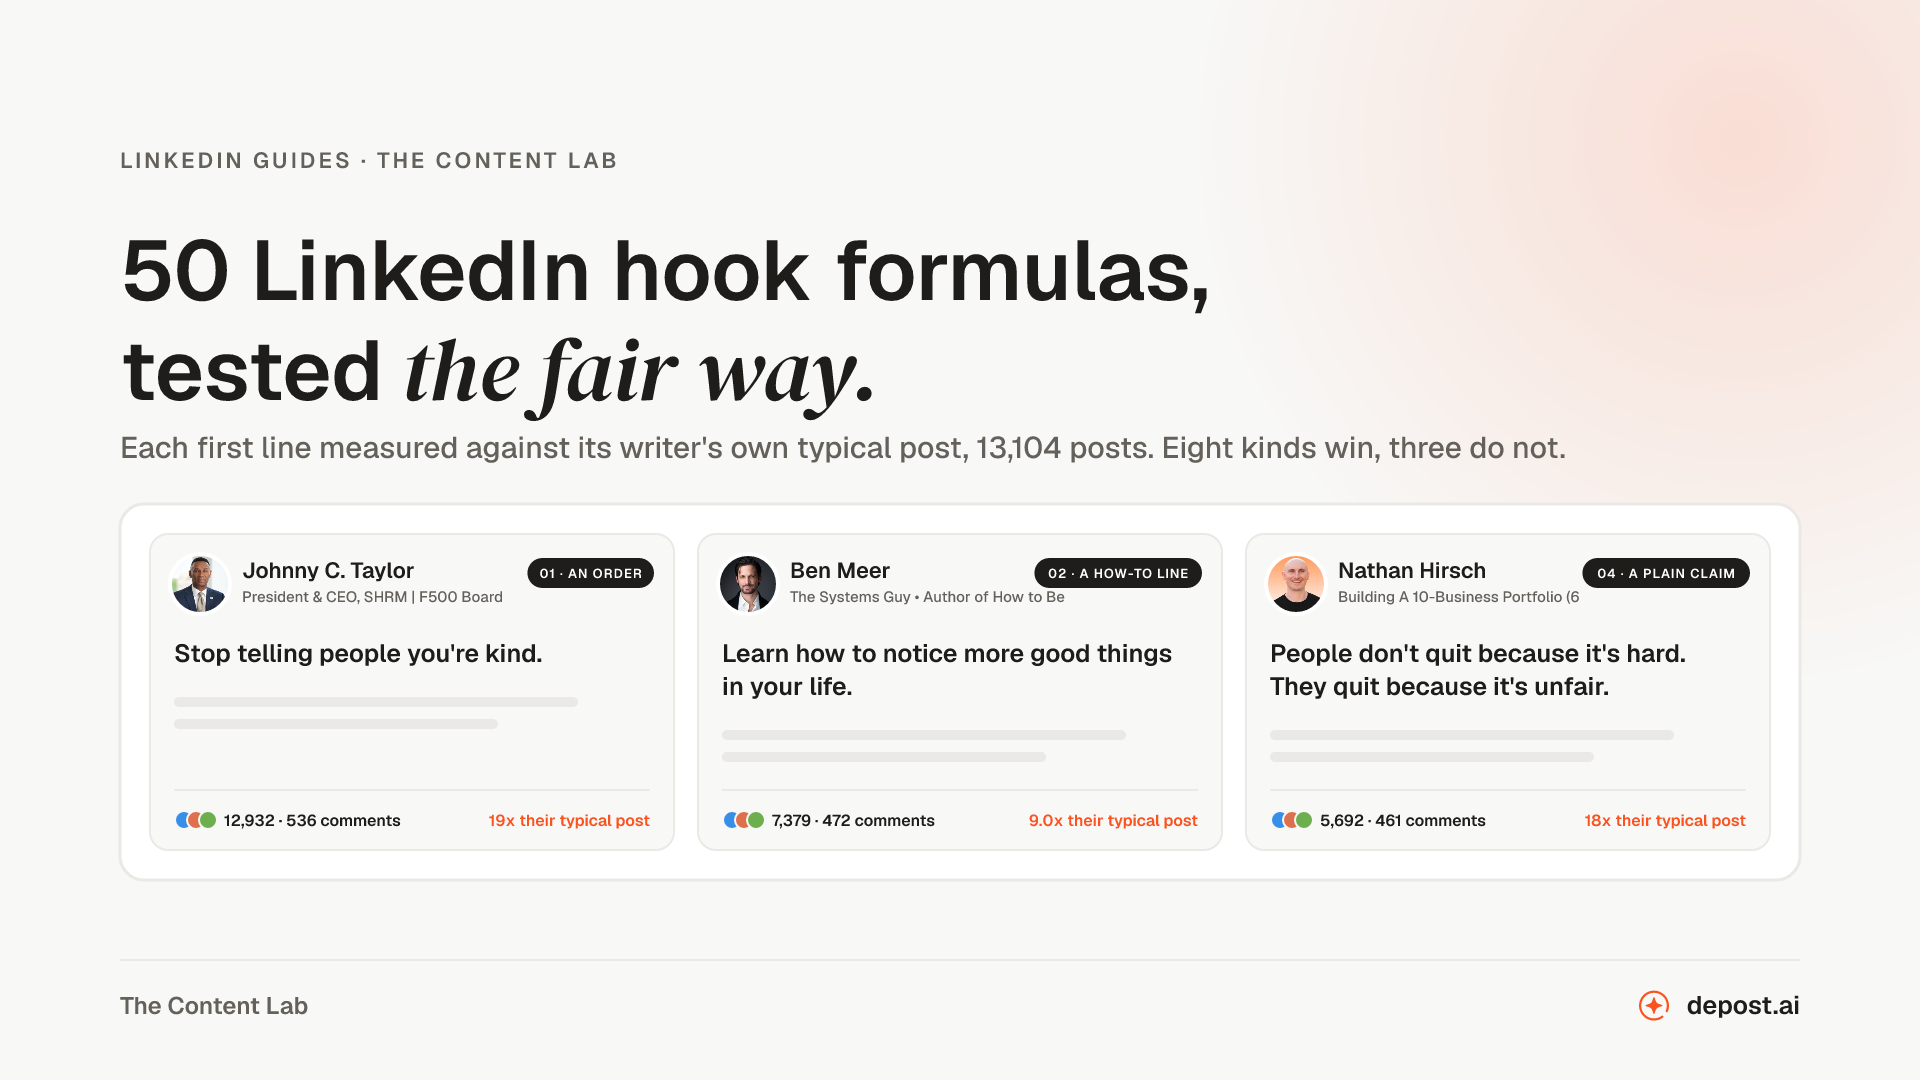
Measured against each writer’s own average, a plain bold claim was the only opening line that beat it, at 1.06. A question or a pain-then-promise opener earned 0.82. Both figures are from our test of 12,791 posts. If your recent posts open with a question, that is the first thing to change.
2. You changed subject
The feed decides who to test your post on, and it learns that from your history. LinkedIn’s March 2026 announcement says the new system reads “what a post is actually about and how your professional interests evolve,” and matches posts to readers by meaning rather than keywords. Change subject and your post goes to a colder test group, people who followed you for something else. Reach recovers when you go back to one subject and stay there for a few weeks.
3. You changed format
Format moves a post more than most writers expect. In the fair test, a single image lifted a post to 1.39 of the writer’s typical result. It did so for 72% of the 222 creators who posted both with and without one. Text with no picture earned 0.69. On my own account over three months, image posts averaged 1,142 impressions and text-only posts 241. If you drifted from images to plain text, that alone explains a halving.
4. You put a link in the post
A link in the body costs reach, and nobody agrees on how much. In the fair test a post ending with a link earned 0.80 of the writer’s typical post. On 27 Depost AI accounts measured against their own posts, the link cost 18%. The vendor studies on the first page of Google put the penalty anywhere from 7% to 68%. The one page that lines them up concludes they cannot be reconciled. LinkedIn has never confirmed a link penalty. What is consistent is the direction: a post whose job is to send people away earns fewer of the actions that carry it.
5. You posted on the wrong days
One account’s numbers, offered as a pattern to check rather than a rule. On mine, the median post published Monday to Thursday earned 766 impressions. The median post published Friday to Sunday earned 390. Four of my five worst posts in the quarter went out on a Friday or a Sunday. If your drop coincides with a change of day, that is the cheapest test there is. The posting-time studies disagree with each other by up to twelve hours, so check your own.
6. The post’s visibility setting
A post set to “Connections only” cannot reach beyond your first-degree connections. LinkedIn’s help page on post visibility lists three settings: “Anyone,” which is “visible to anyone on or off LinkedIn, including your extended network”; “Connections only,” which is “visible to only 1st-degree connections of the post author”; and “Group.” It is one click in the composer and easy to change by accident. Check the setting on the posts that dropped.
7. It is noise, and you are reading one post
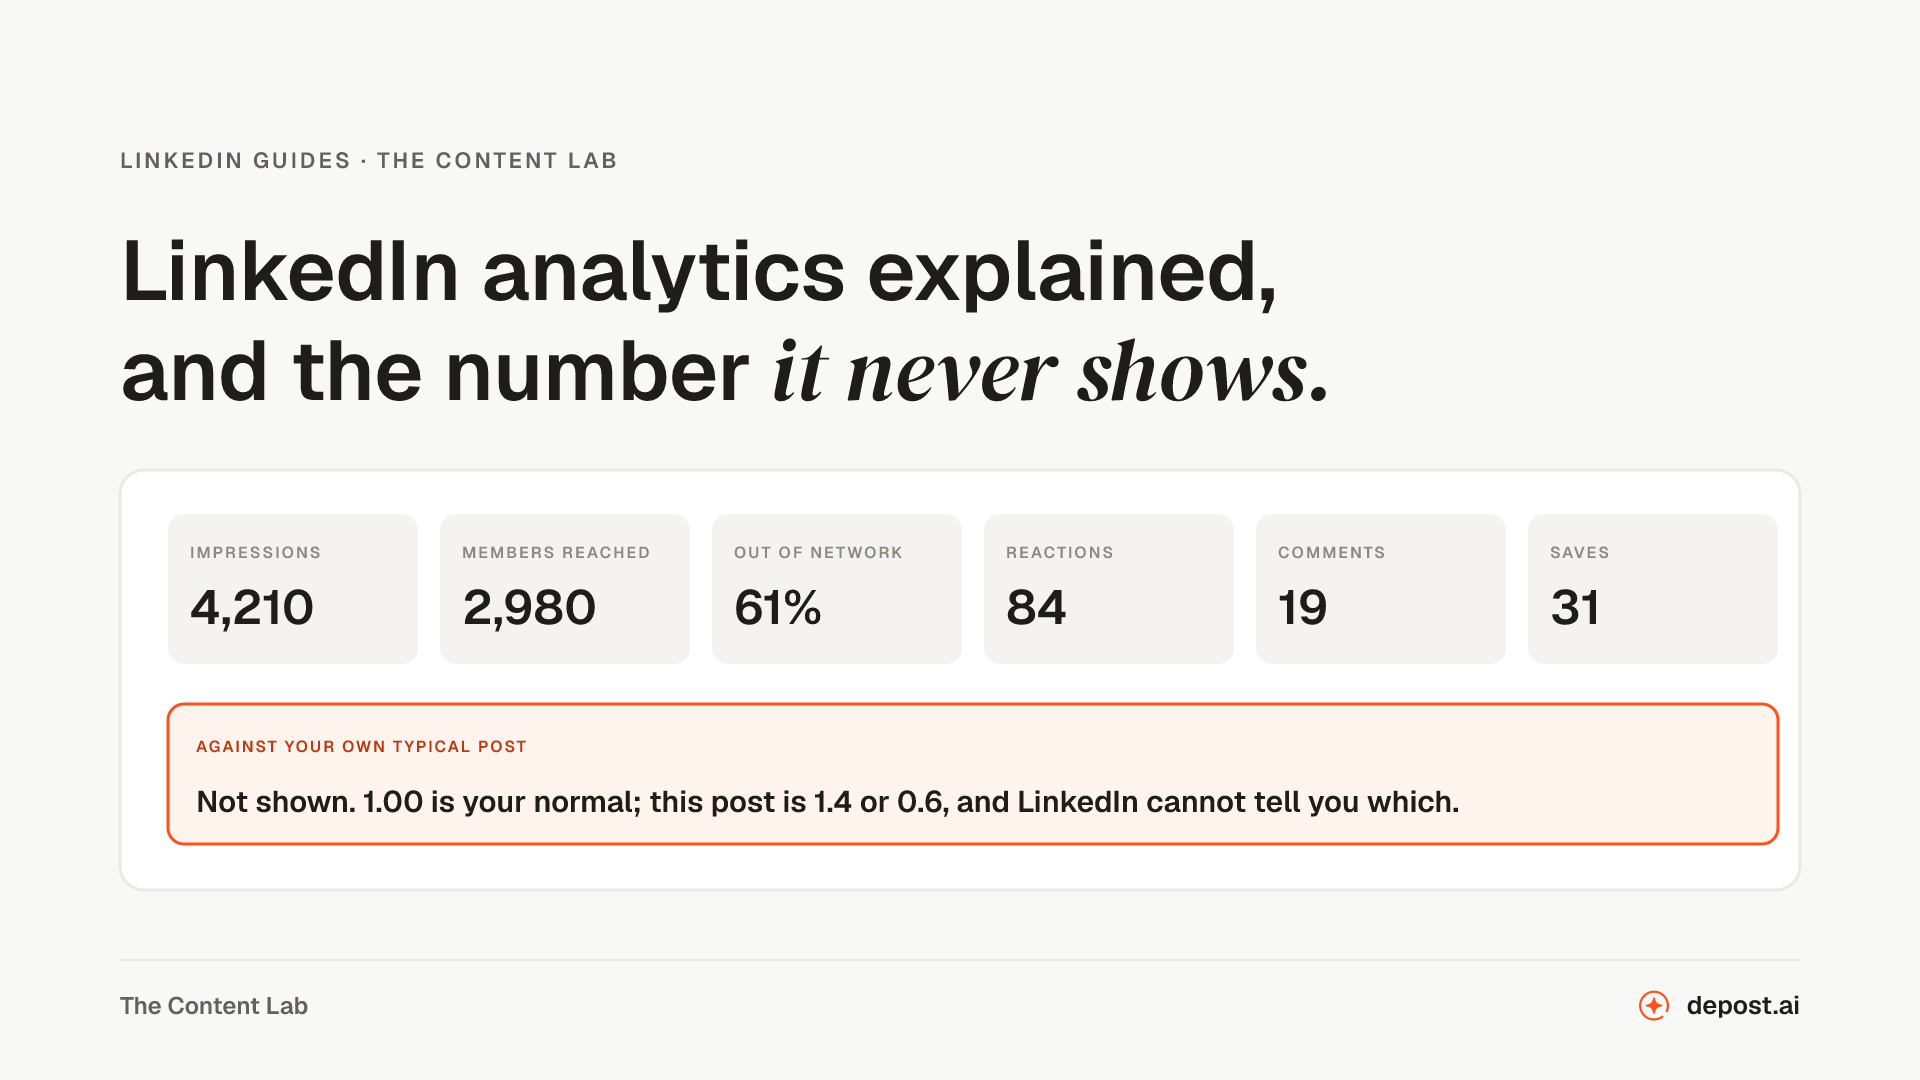
Reach is noisy and one quiet post is not a signal. Four posts carried half of my own reach last quarter. Compare your median across a month against the month before, not your last post against your best. Since June 2026 LinkedIn also shows what share of a post’s impressions came from outside your network, which its director of creator products described as “a percentage breakdown of who has seen your content, based on if they’re already in your network or not.” A post with a low out-of-network share was never shown beyond your followers. That is a post that lost the first test, not a post that was hidden.
8. Readers flagged it as AI-like
This one leaves a mark you can see. Since 30 July 2026 readers can flag a post with “Seems like AI slop.” A flagged post, per Engadget’s report of LinkedIn’s words, gets “reduced algorithmic reach similar to users’ flagging them as ‘not interested,’” and the author is told privately in analytics. LinkedIn’s Chief Product Officer said in August that content it classifies as AI slop was getting “around 40 percent fewer views” than a few weeks earlier, and that “no single piece of feedback is used to adjust how widely a post travels,” per The Register. If the note is in your analytics, the cause is the writing, and what LinkedIn has said about AI-written posts covers what to do.
9. Enforcement, which comes with a notice
The only published mechanism that limits a post’s visibility is policy enforcement, and LinkedIn says it tells you. Its help page How we enforce our Professional Community Policies reads: “Depending on the severity of the violation, we may limit the visibility of certain content, label it, or remove it entirely.” And: “When we do this, we also generally send you a notice that your content violates our policies, how your content violates our policies, and the action we’re taking.” Appeals are offered “after each violation.”
Account-level restrictions are listed too. The account restrictions page names four categories of violation: content, profile, identity and automated tools. For the last, a separate page says LinkedIn does “not allow the use of third-party software or browser extensions that scrape, modify the appearance of, or automate activity on LinkedIn’s website,” and that a restricted account is re-enabled once the software is removed. Engagement pods sit here as well: LinkedIn’s VP of Product Management said in November 2025 that it is “flagging any artificially boosted content internally” and “limiting the reach of this content,” which the pods post quotes in full.
So the test for this bucket is simple. Did you get a notice, a label, a removal, or a restriction screen? If not, you are not in it.
So, is it a shadowban?
LinkedIn has never confirmed a mechanism called a shadowban, and no help page uses the word. Search its help center and the term does not appear. What it has published is the list above: ranking that reads skips and meaning, reader signals such as “not interested” and the AI flag, and enforcement that comes with a notice.
The pages that rank for “LinkedIn shadowban checker” are written by companies that sell automation or tools to hide it. They have a commercial reason for you to believe that a reach drop is a ban that their product can detect or dodge. Several of them concede, lower down, that LinkedIn has never confirmed the thing they are offering to check for.
What a drop looks like from the inside is identical either way. A post whose first line earned skips and a post that was quietly suppressed would show the same low number. The difference is that LinkedIn has described the first in its own engineering writing and has described the second only as enforcement with a notice. The honest reading of a drop with no notice, no flag and no restriction is that you have been outranked, not banned.
One check that costs nothing. Open one of the dropped posts logged out, or ask someone outside your network to open its link. A post set to “Anyone” is, in LinkedIn’s words, “visible to anyone on or off LinkedIn,” including people who are not members. If it is there, it has not been hidden. It has been shown to fewer people than you hoped, which is what the nine steps above are for.
What to do this week
- Find your own median. Twenty posts, impressions and reactions-plus-comments-plus-reposts, the middle value of each. That is your 1.00.
- Mark the posts under it. Not the ones under 840 or 581; the ones under your number.
- Walk the list above against those posts. The first line, the subject, the format, the link, the day, the setting. One of them usually changed at the same time the numbers did.
- Change one thing for the next three posts and watch the out-of-network share. A post that travels again has a share above your recent normal.
Depost AI does the first two steps against your whole history. Connect LinkedIn and the Performance Analyzer scores every post you have published against your own typical post. It marks the ones that fell under it and shows what the winners shared: the shape, the opener, the format. The analysis is free and needs no card. It can only read what is there. On a profile with a dozen posts it has less to say than on one with a hundred.
FAQ
Why did my LinkedIn impressions suddenly drop?
Check six things, in order. A weaker first line, since scrolling past a post is a signal LinkedIn’s ranking model trains on. A change of subject. A change of format, such as images to plain text. A link in the post body. A change of posting day. The post’s visibility setting. If none changed, compare a month’s median against the previous month’s rather than one post against your best. Reach is also down across the platform: LinkedIn reports posts growing 14% in a year while time spent on content grew 10%.
How many impressions is good on LinkedIn in 2026?
The three public datasets put the median post at 572, 581 and about 840 impressions, depending on the sample. The median post has 11 reactions and 2 comments. By audience size, MagicPost’s September 2026 medians run from 190 impressions for accounts under 1,000 followers to 10,272 above 100,000. Accounts with 10,000 to 25,000 followers sit at 1,414. A good number is one above your own median over your last twenty posts.
Does LinkedIn shadowban accounts?
LinkedIn has never confirmed or published a mechanism called a shadowban, and the term does not appear in its help center. What it publishes is ranking that reads skips and meaning, reader signals such as “not interested” and the “Seems like AI slop” flag, and policy enforcement that limits, labels or removes content, with a notice. A drop with no notice, no flag and no restriction is a ranking outcome.
How do I know if my LinkedIn post has reduced visibility?
Two places. Your post analytics, where LinkedIn adds a private note when readers flag a post as AI-like. The out-of-network share there shows whether a post travelled beyond your followers. And your notifications, because LinkedIn says that when it limits, labels or removes content for a policy violation it “generally” sends a notice explaining the action. A post set to “Anyone” that opens when you are logged out has not been hidden.
Is LinkedIn reach down in 2026 for everyone?
Yes, on every measure that has a source. LinkedIn’s own results show original posts up 14% year on year and time spent on content up 10%. The largest third-party study, 1.3 million posts from 50,000 creators, puts reach down 60% for active creators over two years. A monthly public-post benchmark shows the median post down 21% between October 2025 and September 2026.
Do links reduce LinkedIn impressions?
In our test a post ending with a link earned 0.80 of the writer’s typical post. On 27 Depost AI accounts a link cost 18%. Vendor studies put the penalty anywhere from 7% to 68% and cannot be reconciled. LinkedIn has never confirmed a link penalty. A link in the first comment protects the post but earns fewer clicks, so decide which the post is for.
Why do my connections not see my posts?
Most often because the feed is ranked by predicted interest, not by connection. A post that lost its first test is shown to few people, connected or not. Check that the post’s visibility is “Anyone” rather than “Connections only,” check the out-of-network share in post analytics, and check whether the post’s first line, subject or format changed from the posts your connections did respond to.
How do I get my LinkedIn impressions back?
Find your own median over twenty posts and mark the posts that fell under it. Then find the step in the checklist that changed when they did. Change one thing for the next three posts. A real image on every post, a first line that is a claim rather than a question, the link moved to the first comment, or Monday to Thursday. Measure the out-of-network share on those three. Reach comes back post by post, not account by account.