LinkedIn profile analyzer
Paste your profile address and get a report on your last three months, with every post measured against your own typical post instead of somebody else's benchmark. The analysis runs on the account you connect, so it can see your impressions. Free, no card. Here is the whole report first, on a made-up account, so you can see what arrives before you sign up for anything.
Your LinkedIn profile
What happens next. You sign up, connect the account that profile belongs to, and it reads your last three months. The report below is what comes back, on your posts instead of these.
Beyond one number
This page rates one post. Depost AI rates them all.
Connect LinkedIn and the Performance Analyzer benchmarks every post against your own average, names the hooks and formats that earn the engagement, and the next draft starts from what worked. Your full posting history, not a sample.
How it works
- 1
Paste your profile address
The one that looks like linkedin.com/in/your-name. Nothing is read from it on this page; it travels with you to signup so you do not have to type it twice.
- 2
Sign up and connect that account
The analysis runs on the account you sign in to, which is how it can see your impressions. It is free and takes no card.
- 3
Read the report
Your last three months, each post measured against your own typical post, with your best and weakest side by side, the kinds of post that work for you, how you compare with creators in your field, what to change, and what to write first.
The report, start to finish
This is the whole thing, not a teaser of it. The account below is invented and so is every number on it, because showing you a real member's posts to sell you a product would be a strange way to earn your trust. The sections, the order and the way each figure names its own evidence are exactly what arrives on your account.
Sample report
What your posts say, Dana.
Findings from her own 22 posts. Each figure says how many of her posts it rests on, because four posts and forty are not the same claim.
Her best post and her weakest, side by side
“We cut our onboarding from six weeks to nine days by deleting one approval step.”
578 interactions · one image · ended on the point · 2 September
“Great teams are built on trust, and trust is built in the small moments.”
125 interactions · one image · ended on a question · 7 September
Both used one image, five days apart. The format is not what separated them.
Which kinds of post work for her
What works
What to stop
A kind of post needs three of her posts behind it before it appears at all.
Her against creators in her field
Her Them
One image
16 of hers
1.31 vs 0.98
A hot take with the reasoning
6 of hers
1.14 vs 1.12
A personal post
5 of hers
1.04 vs 1.07
A how-to
4 of hers
0.91 vs 1.01
Text with no picture
4 of hers
0.58 vs 0.65
The hairline is 1.00: a typical post for her, and for them. Their figures come from creators of every size, each measured against their own typical post.
In one sentence
Both were one-image posts, so the picture is not what separated them: her best named a change the reader can make on Monday, while her weakest described how good teams feel.
The onboarding teardown took 578 interactions, 2.41 times her average. The trust post took 125, 0.52 times. One image runs at 1.31 across 16 of her posts, so the format was not the difference.
What to change
What her own posts say, measured against the strategy she confirmed. Each change says what her posts did, why it matters, and the one thing to do about it.
3
of her posts sit behind this
Stop leading with
Her widest post teaches a subject she asked to drop
- Her posts
- "We cut our onboarding from six weeks to nine days by deleting one approval step" earned 578 interactions, 2.41 times her average, and it is pure process writing.
- Because
- Process teardowns are on her de-emphasised list, so her most visible post pulls the audience toward work she no longer sells.
- So
- Keep the teardown, change what it points at: end each one on the hire or the budget decision it unblocks, not on the process itself.
1.31×
one image · 16 of her posts
Format directional
Her text-only posts undercut her images
- Her posts
- Her 16 image posts average 1.31 times her own typical post. Her 4 text-only posts average 0.58. The gap is the widest of any split in her account.
- Because
- Sustained attention is a ranking signal and a document post holds it longest, yet she has not used one in 22 posts.
- So
- Test two carousels built from posts she has already written: the onboarding teardown, and the approval-step audit.
1
of her posts sits behind this
Who for
Almost nothing names her reader
- Her posts
- Across 22 posts, one opening names an operations lead. Her confirmed audience is heads of operations at companies of 50 to 300 people.
- Because
- Reach is driven by who engages early, and a smaller audience that recognises itself is worth more than broad agreement from everyone.
- So
- In at least one post a week, use a named operations scenario: the handover, the approval chain, the first week of a new hire.
And what to write first
Every idea names its source, so she can argue with the evidence rather than with the idea.
We deleted an approval step and nothing broke. That is the whole case study.
Why this shape. A hot take with the reasoning runs 1.14 times her average across 6 posts, and the subject is the one her audience already rewarded.
Rests on: the onboarding teardown that took 578 interactions, her widest post of the quarter.
Before: four people had to approve a new hire's laptop. After: one did, and the laptop arrived on day one.
Why this shape. A before-and-after beats the writer's own average for 76% of the creators measured in her field this quarter.
Rests on: a change she has already made and has the dates for.
Dana is not a real member. Her account and every number above are made up to show the layout. Your report is built from your own posts.
Run this on my accountWhy it measures you against you
Most profile tools score you against a benchmark, and most benchmarks are a statement about audience size wearing a disguise. A post with 400 reactions is a quiet Tuesday for an account with 80,000 followers and the best post of the year for an account with 2,000. Put the two side by side and the number tells you who has the bigger list, which you already knew.
Dividing every post by the same writer's typical post takes the audience out of the comparison. What is left is what the writing, the format and the subject did. It is the method behind our own test of the LinkedIn rules, and it is why the report can say a format works for you while the same format fails for the field, or the reverse.
The comparison section does the same thing to everybody else. Creators in your field are each measured against their own typical post too, so when the report says a shape runs at 1.12 for them and 0.91 for you, both numbers mean the same thing and the gap is real rather than an artefact of who has more followers.
What it will not do
It will not analyze a stranger. The address you paste here is carried to signup and nothing else. The report is built from the account you sign in to. A tool that reads any profile from a URL is reading somebody who never agreed to it, and that is not a feature we want.
It will not quote you a dwell time. Nobody outside LinkedIn can see how long people spend on a post, and the dwell benchmarks circulating online do not come from LinkedIn. The report sticks to what your account can actually see.
It will not dress up a thin sample. Every figure says how many of your posts it rests on, and a kind of post needs at least three before it appears at all. Where there is not enough to say something, the report says that instead.
Questions
- Does this analyze a profile from the URL alone?
- No, and that is deliberate. This page does not read the address you type; it carries it to signup. The report is built from the account you sign in to, using the posts and impressions that account can see. Analyzing a stranger from a URL would mean reading their profile without asking them, which we will not do.
- What does the profile analyzer actually measure?
- Your last three months of posts, each one scored against your own typical post rather than against a stranger's benchmark. It names your best and weakest post and what separated them, the kinds of post that beat your average and the kinds that fall under it, how each of those compares with creators in your field, and the changes and post ideas that follow from the evidence.
- Why measure against my own average instead of a benchmark?
- Because a benchmark is mostly a statement about audience size. A post with 400 reactions is a quiet week for one account and the best month of another. Scoring each post against the same writer's typical post removes the account size and leaves what the writing and the format did.
- Is it free, and does it need a card?
- The analysis is free and needs no card. You create an account because the report is built from your own posts, which means you have to be signed in as you.
- How many posts do I need for it to say anything?
- Roughly twenty published posts in the last three months gives every section something to stand on. Below that the report still runs, but it says which findings rest on too few posts rather than dressing up a thin sample. Each figure names how many of your posts it rests on.
- Can I analyze somebody else's profile?
- No. The report is built from the account you connect. If you want to know what works for the people you compete with, the comparison section does that honestly: it measures creators in your field against their own typical posts and shows you where you sit, without reading anyone's profile on your behalf.
- What happens to the profile address I type here?
- It goes into the link that takes you to signup and nowhere else. This page stores nothing, sends nothing to us, and makes no request to LinkedIn. If you close the tab, it is gone.
- Will it tell me my dwell time?
- No, because nobody outside LinkedIn can see dwell time. No analytics screen reports it and no benchmark for it has ever been published. The report uses what your account can actually see, which is impressions, reactions, comments, reposts and the shape of each post.
From the blog
All posts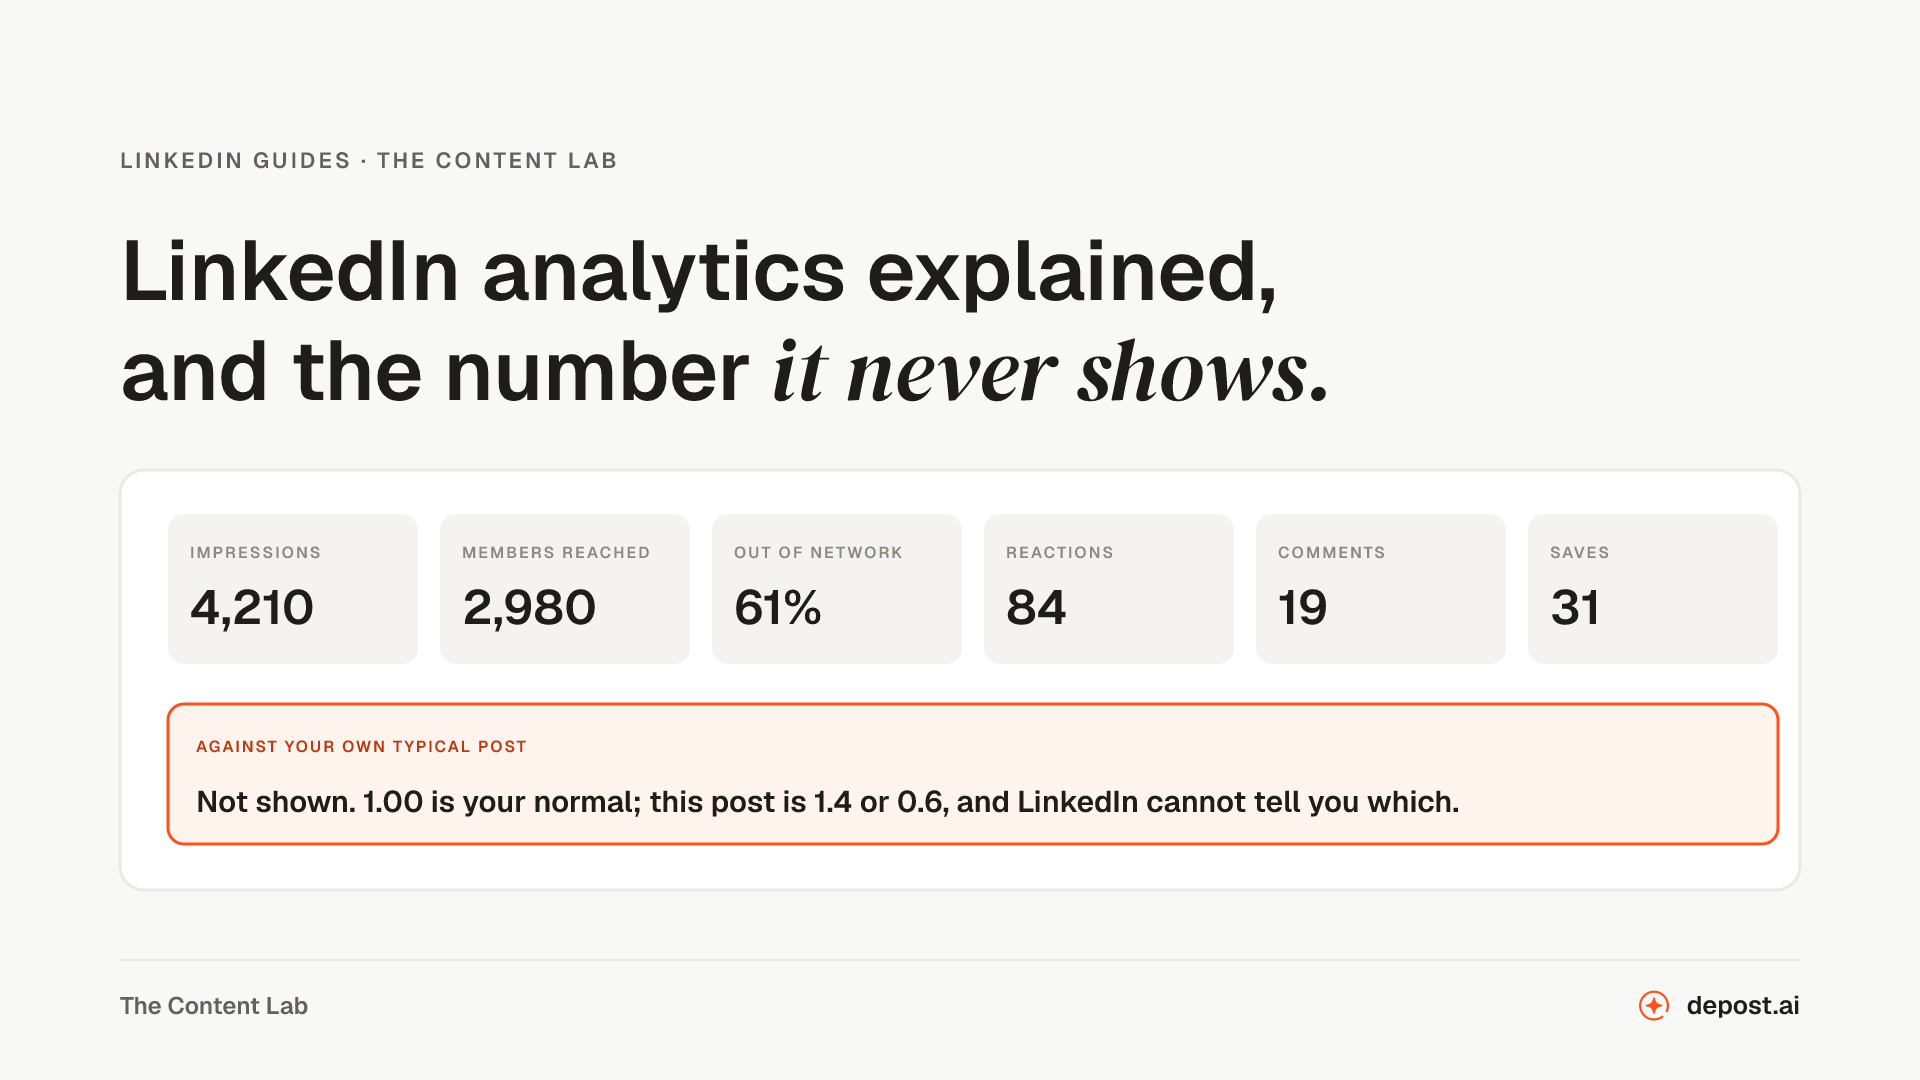 LinkedIn GuidesLinkedIn Analytics Explained: Every Number on Your Profile, and the One It Never ShowsWhere the numbers live, what each one means in LinkedIn's own words, how long they are kept, how to get them out, and the one figure LinkedIn never shows a personal profile: your own average.
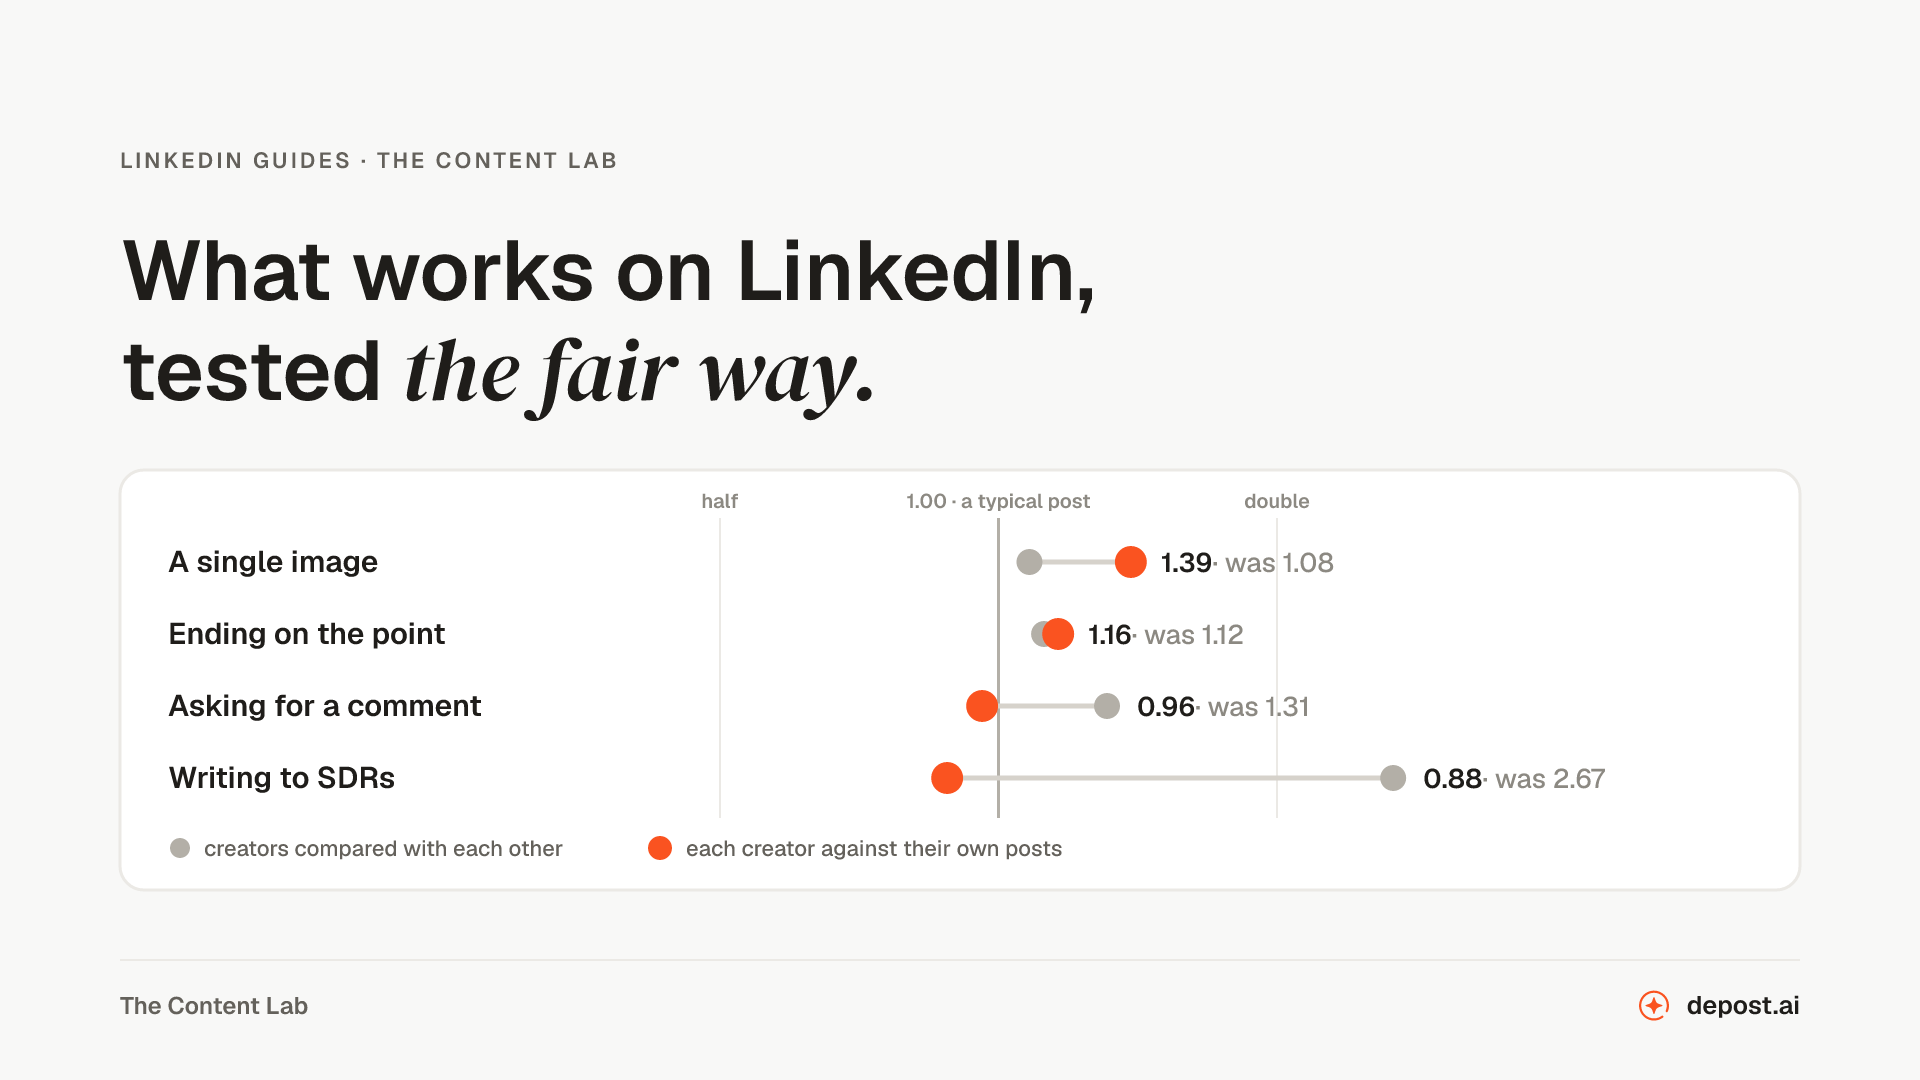 LinkedIn GuidesWhat Works on LinkedIn in 2026: 14 Rules Tested Against Each Creator's Own PostsWe scored 12,791 LinkedIn posts from July to October 2026 against each writer's own average instead of against each other. Seven rules held, seven collapsed, and one reversed.
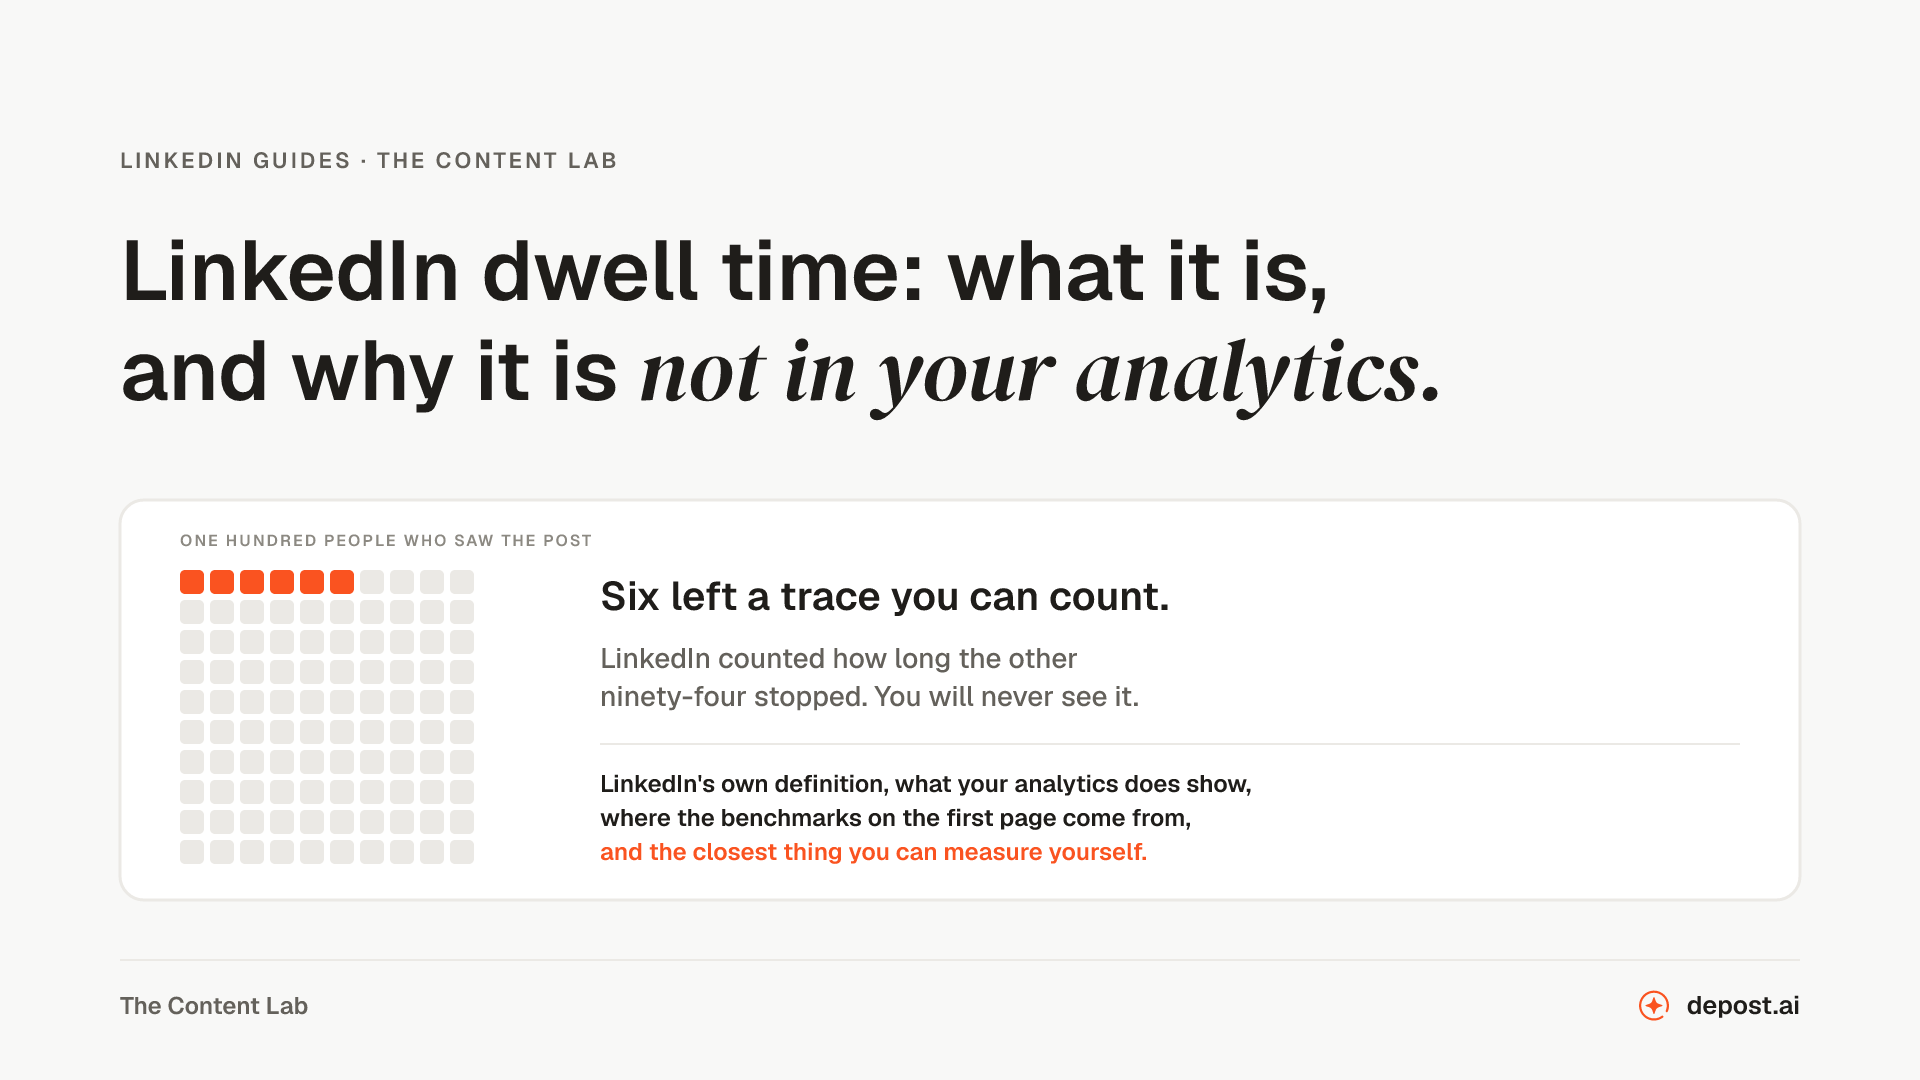 LinkedIn GuidesLinkedIn Dwell Time: What It Is and Why It Is Not in Your AnalyticsLinkedIn measures how long you stop on a post, says so in its own engineering papers, and shows you none of it. Here is the real definition, what your analytics does report, and the closest stand-in you can compute.
Next
LinkedIn Post Analyzer
A grade out of 100 against a fixed rubric, the lines to rewrite with a fix for each, and the lines to keep.
LinkedIn Engagement Rate Calculator
Your engagement rate from impressions and interactions, next to the current platform average so the number means something.
LinkedIn Headline Generator
Turn a job title into a headline that says what you do and who for, in the words your audience actually searches.
Make LinkedIn your
best-performing channel.
Brief your team once. It studies, plans, writes, designs, and schedules. You approve.
Your brief comes with you: once you're set up, it's the team's first job.
7 days free · Strategy in your first 15 minutes · Cancel anytime