# LinkedIn Analytics Explained: Every Number on Your Profile, and the One It Never Shows
Canonical page: https://depost.ai/blog/linkedin-analytics-explained
Where the numbers live, what each one means in LinkedIn's own words, how long they are kept, how to get them out, and the one figure LinkedIn never shows a personal profile: your own average.
By [Yasir Abbas](https://depost.ai/authors/yaser), Depost AI. Published 2026-10-14.
**Short answer:** LinkedIn gives a personal profile three sets of analytics: post analytics under each post (impressions, members reached, in-network and out-of-network share, reactions, comments, reposts, saves, sends, link clicks, profile views and follows from the post, and viewer demographics), creator analytics under Analytics and tools (combined post performance and follower growth over 7 to 365 days, exportable to a spreadsheet), and profile insights (profile viewers and search appearances). It keeps engagement counts for 1,000 days, reach for 400 and demographics for 180. It does not show other people's impressions, dwell time, a native engagement rate for profiles, or how a post compares with your own typical post, which is the number that tells you what to write next.
LinkedIn's analytics are better than most people think, and worse in one specific way. Better, because a personal profile now gets a dozen numbers per post, demographics of who saw it, and a spreadsheet export. Worse, because none of it tells you the one thing you need before writing the next post: what your own normal is, and which posts beat it.
This is a tour of every number LinkedIn gives a personal profile, in LinkedIn's own words from its help pages, read on 14 October 2026. Then the gaps, and how to fill the one that matters.
## Where the numbers live
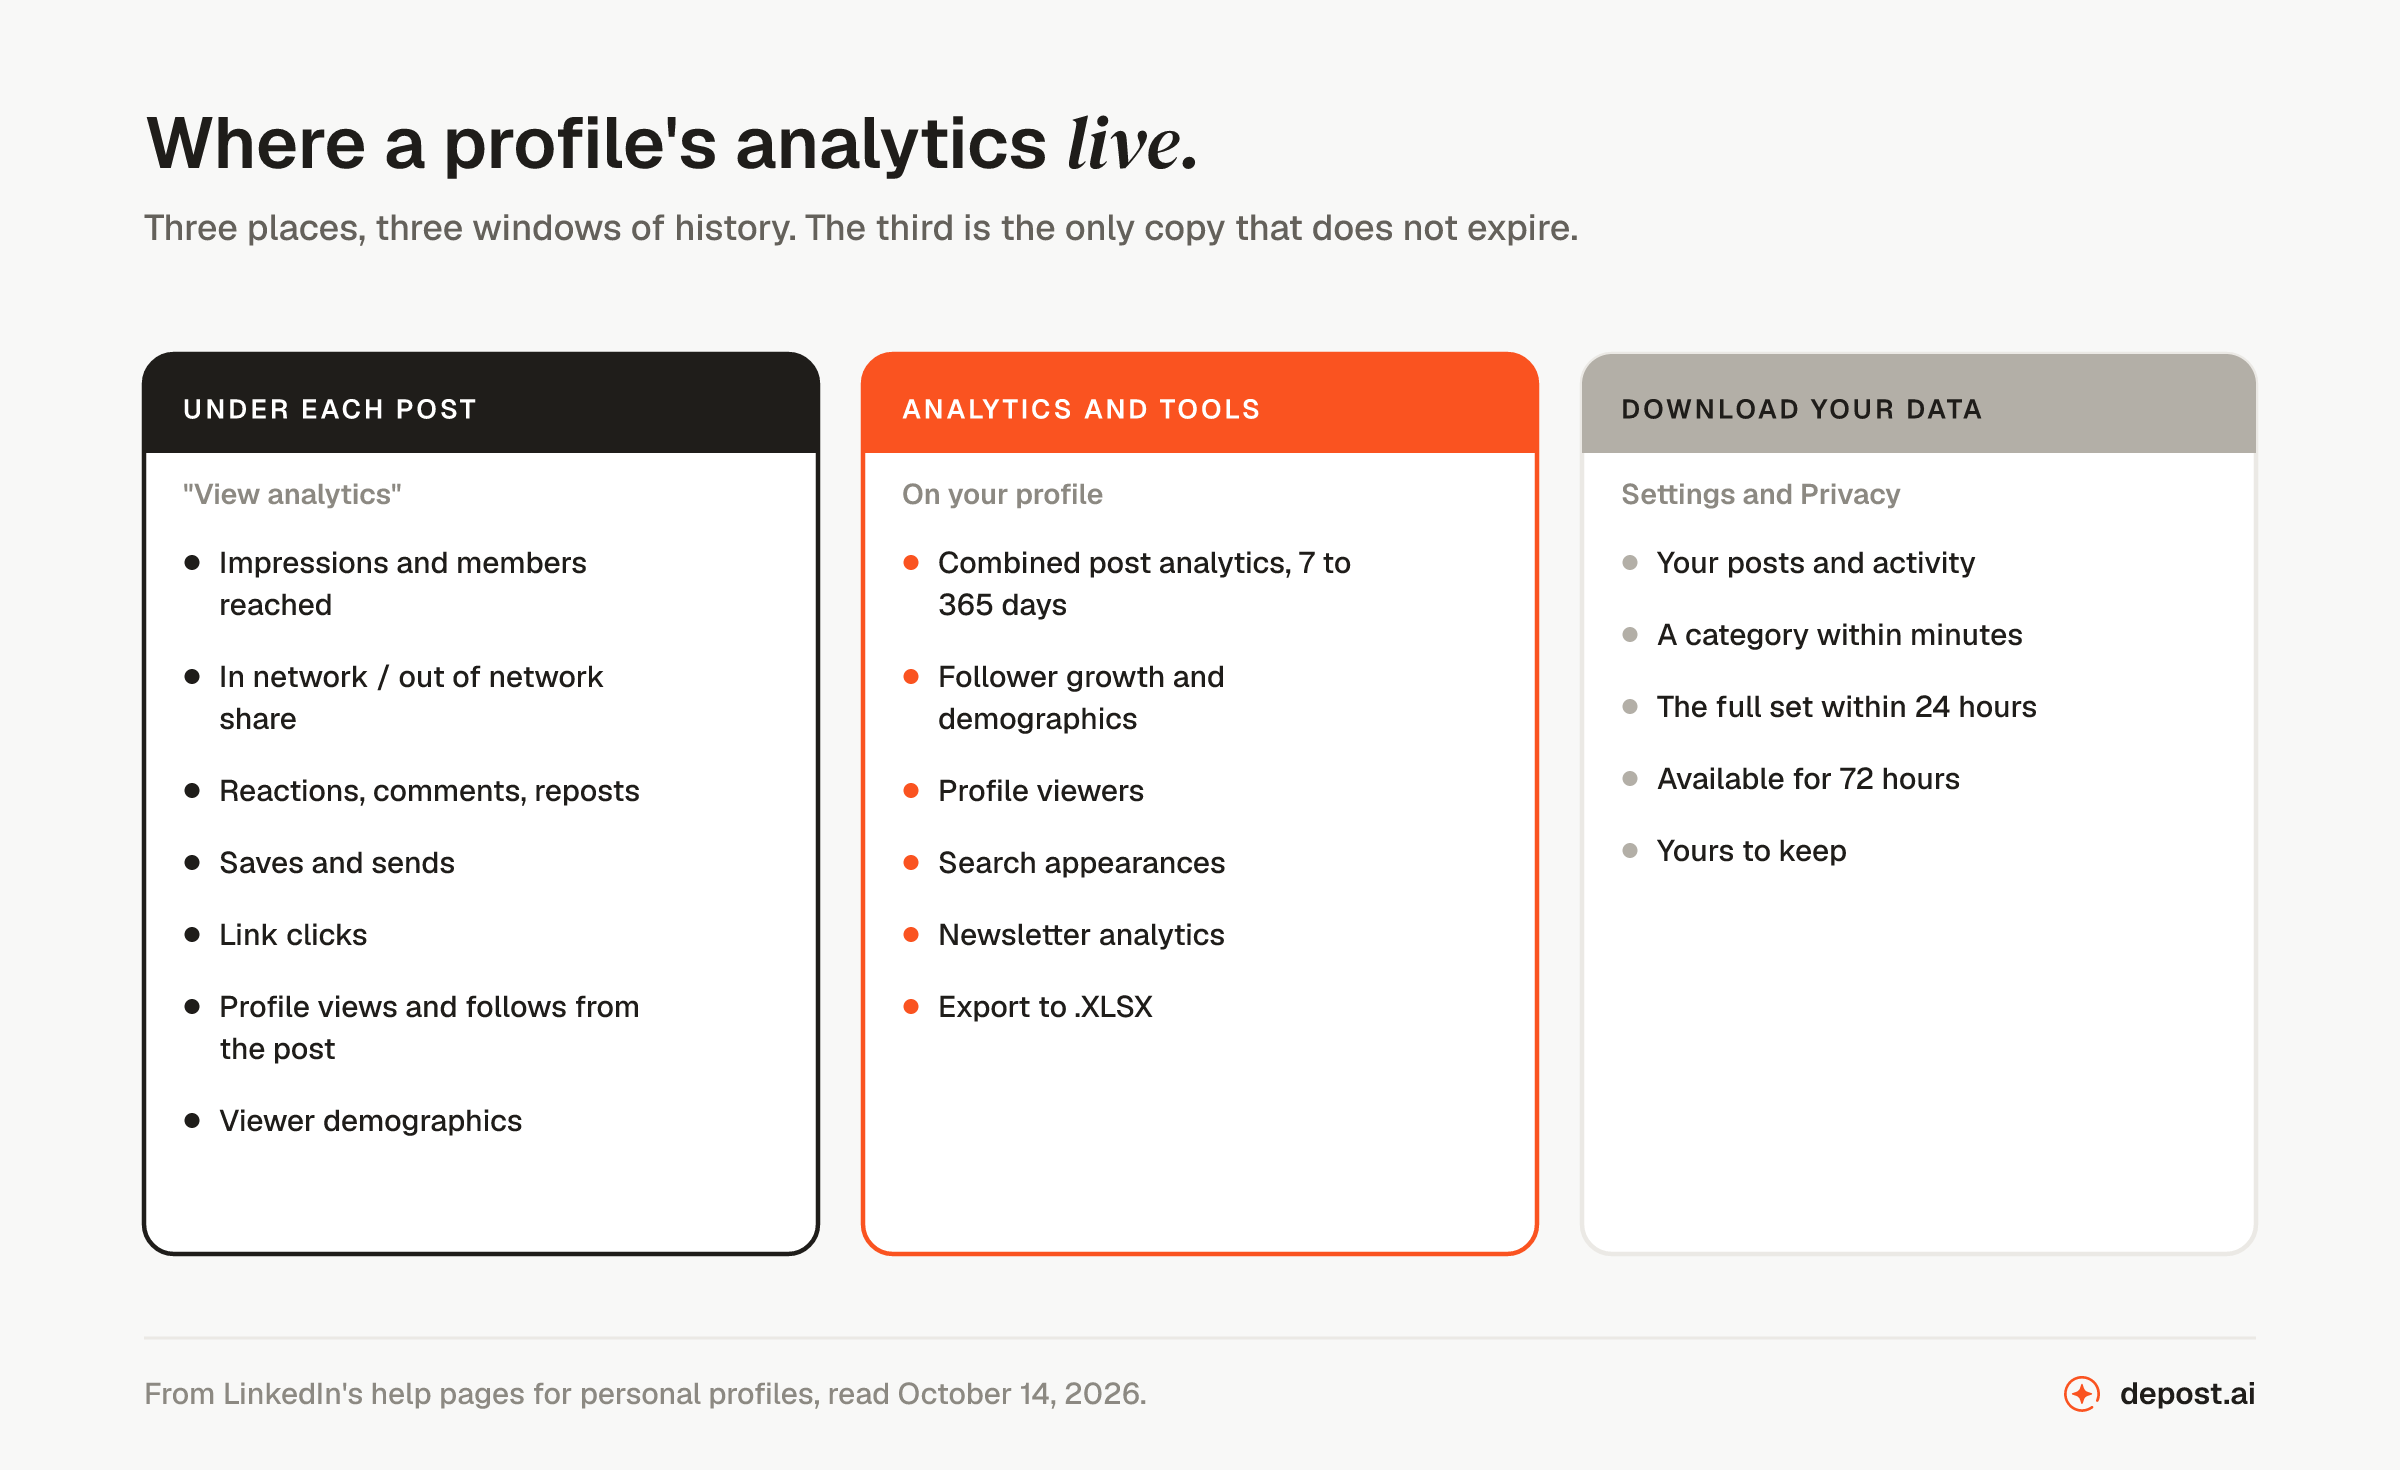
A personal profile has three places to look. Most people only ever open the first.
Three places, three different windows of history. The third is the only one that is yours to keep.
**Post analytics, under each post.** Click the impressions count at the lower left of your post, or "View analytics" at the lower right. [LinkedIn's help page](https://www.linkedin.com/help/linkedin/answer/a525196) adds a line worth knowing: "Only you can view your post analytics. Your own views, social engagements, link engagements, saves, and sends are counted towards the analytics of your content." Your own clicks are in your numbers.
**Analytics and tools, on your profile.** LinkedIn describes it as "a central place to view your performance on LinkedIn and access available creation tools." It holds creator analytics (combined post analytics and audience analytics) and profile insights (profile viewers and profile appearances). Newsletter authors also get newsletter analytics here. On desktop: the Me icon, View Profile, then "Show all" in the Analytics section.
**Your data download, in Settings.** Not an analytics screen, but the only copy of your history that does not expire. More on that below.
## Post analytics, line by line
These definitions are quoted from LinkedIn's [post analytics help page](https://www.linkedin.com/help/linkedin/answer/a516971). LinkedIn last updated it about two months before this was written.
| Number | LinkedIn's definition |
| --- | --- |
| Impressions | "Number of times your post was shown on LinkedIn." |
| Members reached | "Number of distinct members and Pages that saw your post. This number is an estimate and does not include repeat views." |
| In network | "Percentage of impressions from members who follow or are connected to you." |
| Out of network | "Percentage of impressions from members who don't follow or aren't connected to you." |
| Reactions | "The number of times members or Pages reacted (i.e. liked) your post." |
| Comments | "The number of times members and Pages commented on your post." |
| Reposts | "The number of times members and Pages shared your post to their feed." |
| Saves | "The number of times members saved your post." |
| Sends | "The number of times members sent your post to others on LinkedIn." |
| Link engagement | "The total number of times members and Page admins clicked on an external link in your post, including repeat clicks." |
| Profile viewers from post | "The total number of distinct members and Page admins who viewed your profile from your post." |
| Followers from post | "The total number of members who followed you from your post." |
| Demographics | "Demographic information may include the job title, location, company, company size, industry, and seniority of your post viewers." |
Four things in that table are worth more than they look.
**Members reached is the honest reach number.** Impressions count displays. One person scrolling past your post three times is three impressions and one member reached. The [glossary entry on impressions versus reach](https://depost.ai/glossary/impressions-vs-reach) has the distinction. The short version: impressions flatter, reach does not.
**The in-network and out-of-network split is new.** LinkedIn began rolling it out in June 2026. Sam Corrao Clanon, its director of creator products, [described it to Social Media Today](https://www.socialmediatoday.com/news/linkedin-adds-more-post-performance-insights/822193/): "you'll begin to see a percentage breakdown of who has seen your content, based on if they're already in your network or not." A post with a high out-of-network share was carried by the feed's recommendations, reshares or search, not by the people who already follow you. That is the number that tells you whether a post travelled.
**Saves and sends are shown.** People repeat that LinkedIn hides saves. It does not. They are on the post analytics page, and so are sends, which is a private share by message. Both are costly actions for a reader and worth reading.
**Profile viewers and followers from a post are the business numbers.** A post that earned 40 reactions and 2 new followers did one job. A post that earned 15 reactions and 30 profile views did a different one. If you post to sell, the second column is the one to watch. Since 2025 LinkedIn sends a notification when a post drives either.
## How long each number is kept
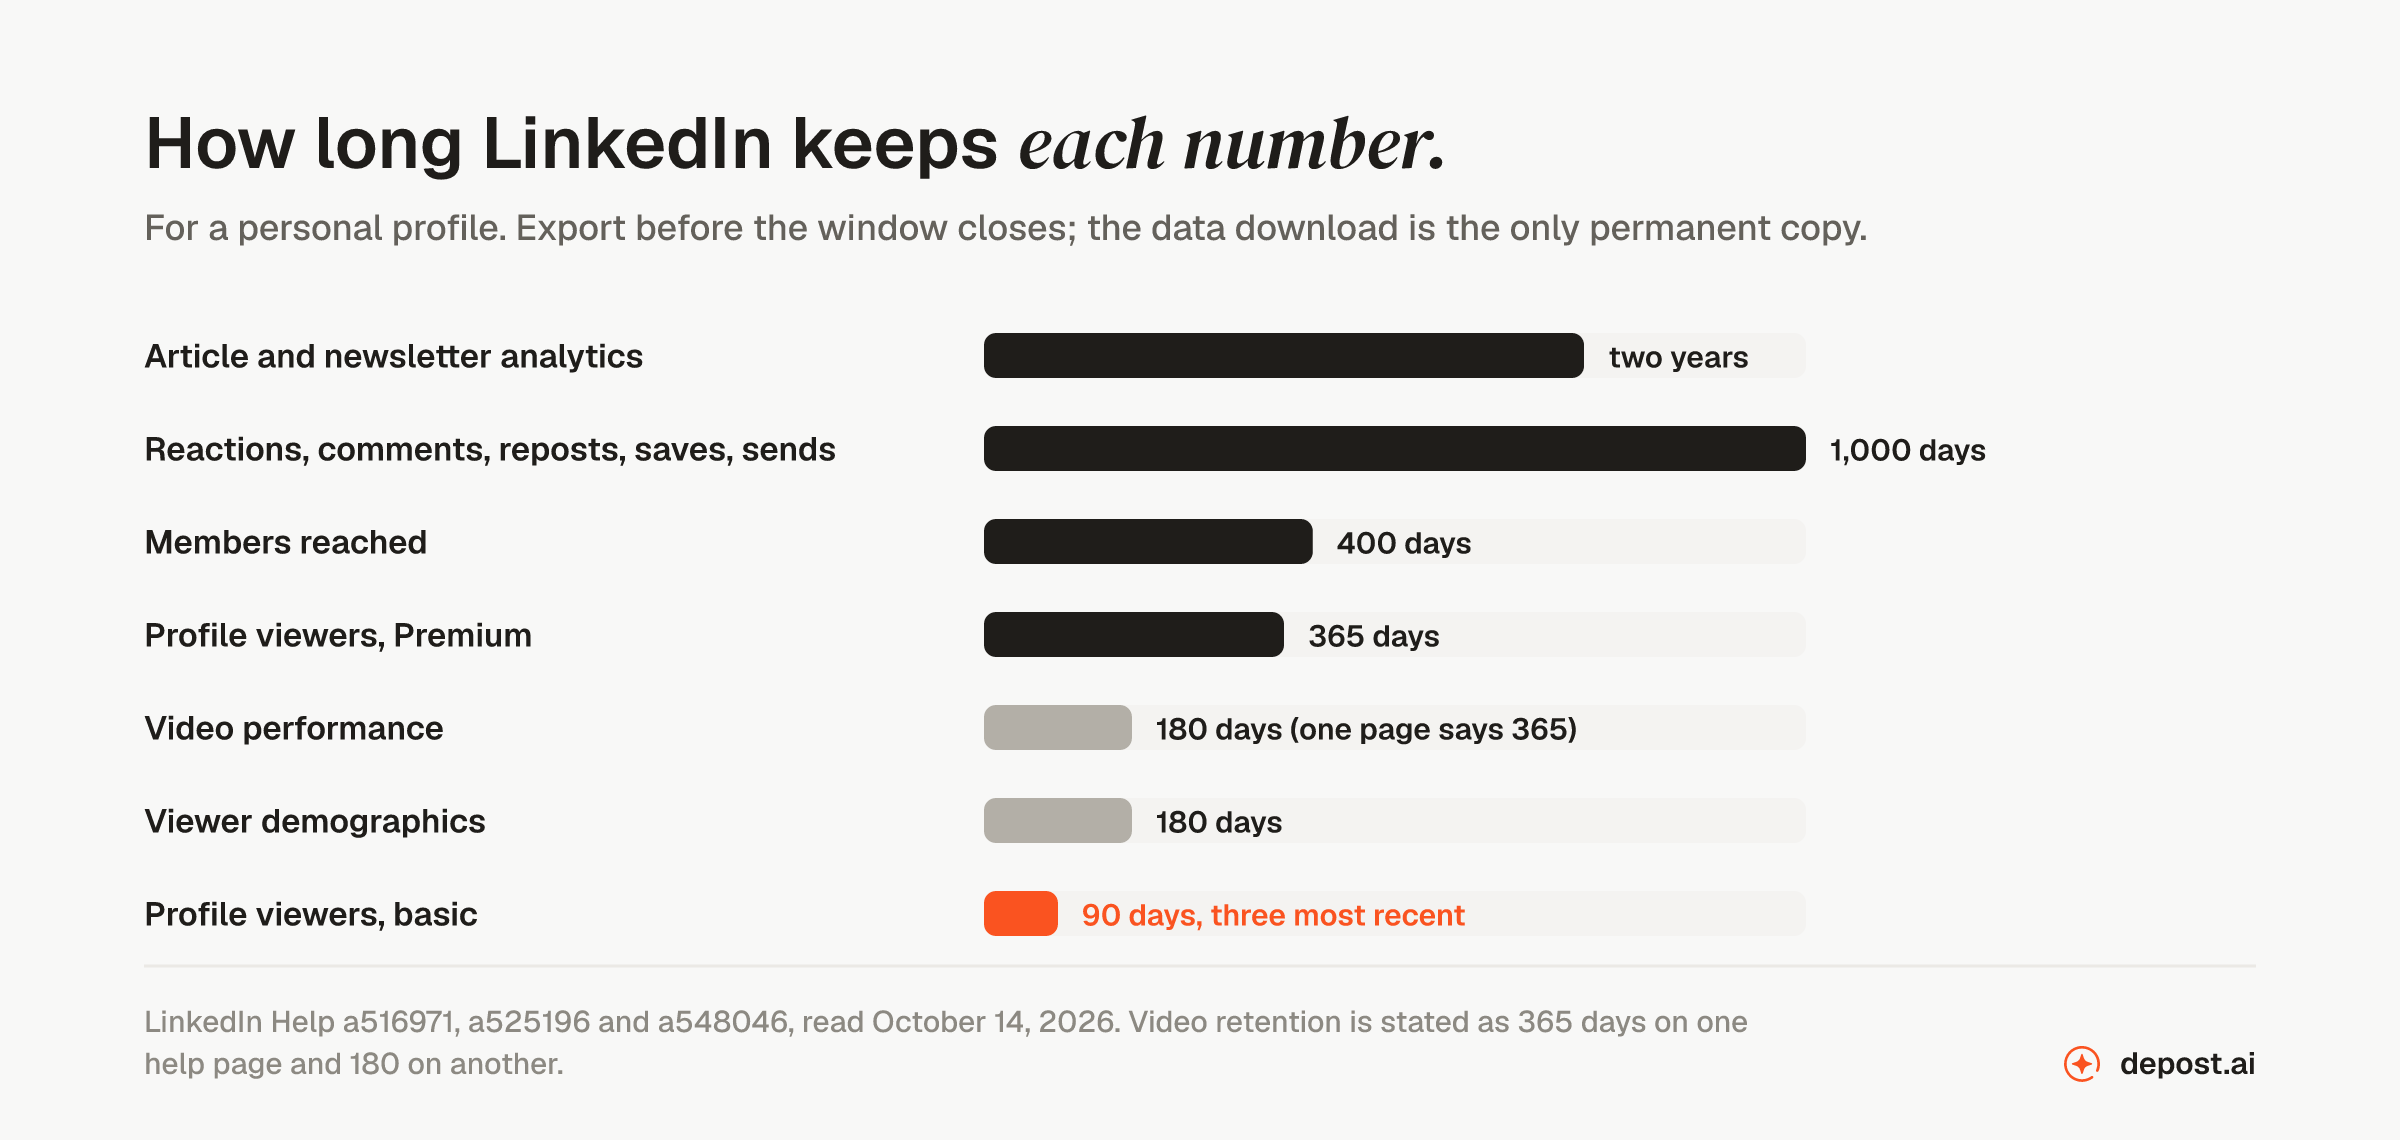
This is the part nobody reads until a number has gone.
From LinkedIn's help pages, October 2026. The data download is the only copy that does not expire.
**From the same help page:** "For all other content types, discovery and social engagement counts are available for 1,000 days. Members reached data is available for 400 days. Demographic breakdowns are available for 180 days." Articles and newsletters keep their analytics for two years. Video is the one LinkedIn's own pages disagree on. One page says video performance is available for 365 days and another says 180, so assume the shorter.
**The practical consequence:** the "who saw this" breakdown on a post from seven months ago is already gone. The reach figure on a post from last year goes next. If you want your history, export it while it exists.
## Creator analytics: the trend over time
**Combined post analytics** sits under Analytics and tools. [LinkedIn says](https://www.linkedin.com/help/linkedin/answer/a701208) it shows "how your content (including short form posts, images, videos, events, polls, and articles) performs over time." You pick a range "from the past seven days up to the past 365 days." A toggle decides whether the trend graph shows impressions or engagements.
**LinkedIn defines the two for this screen** as: "Impressions: The number of times your post was displayed on screen. This number is an estimate and may not be precise." And: "Engagements: The total number of engagements on your posts, including reactions, comments, saves, sends, and reposts." Note what that list includes. Saves and sends count as engagements here, and clicks do not. That matters for the rate question below.
**Audience analytics** sits beside it. [LinkedIn describes it](https://www.linkedin.com/help/linkedin/answer/a1373345) as "insights into your follower growth trends and follower demographics," over the same 7-to-365-day ranges. You can switch the breakdown between job title, location, industry, seniority, company size and company, and "the top five results will be displayed." LinkedIn adds: "All numbers displayed are estimates and may not be precise."
**Both screens have an Export button** at the upper right that produces an .XLSX file. That spreadsheet is the cheapest analytics tool you will ever own.
## Profile insights: viewers and searches
**Profile viewers depend on your plan.** [LinkedIn's comparison](https://www.linkedin.com/help/linkedin/answer/a548046) gives a basic account the "three most recent viewers in the last 90 days." A Premium account gets "up to 365 days of viewer data," the "full list of viewers," and a "weekly viewer trend graph."
**Search appearances are a separate panel.** LinkedIn says it "displays statistics on how many people found you through a search on LinkedIn." It includes "member insights about those who searched for you, such as their companies and job titles," and a list of the "job titles you were found for." It updates "weekly on Wednesdays."
**Do not confuse appearances with views.** In LinkedIn's words: "Profile appearances refer to the instances where your name and headline appear across LinkedIn. Profile Views show how many people have visited your profile."
## The engagement rate LinkedIn never gives you
Here is the first gap. LinkedIn publishes a definition of engagement rate for company Pages, and none for personal profiles.
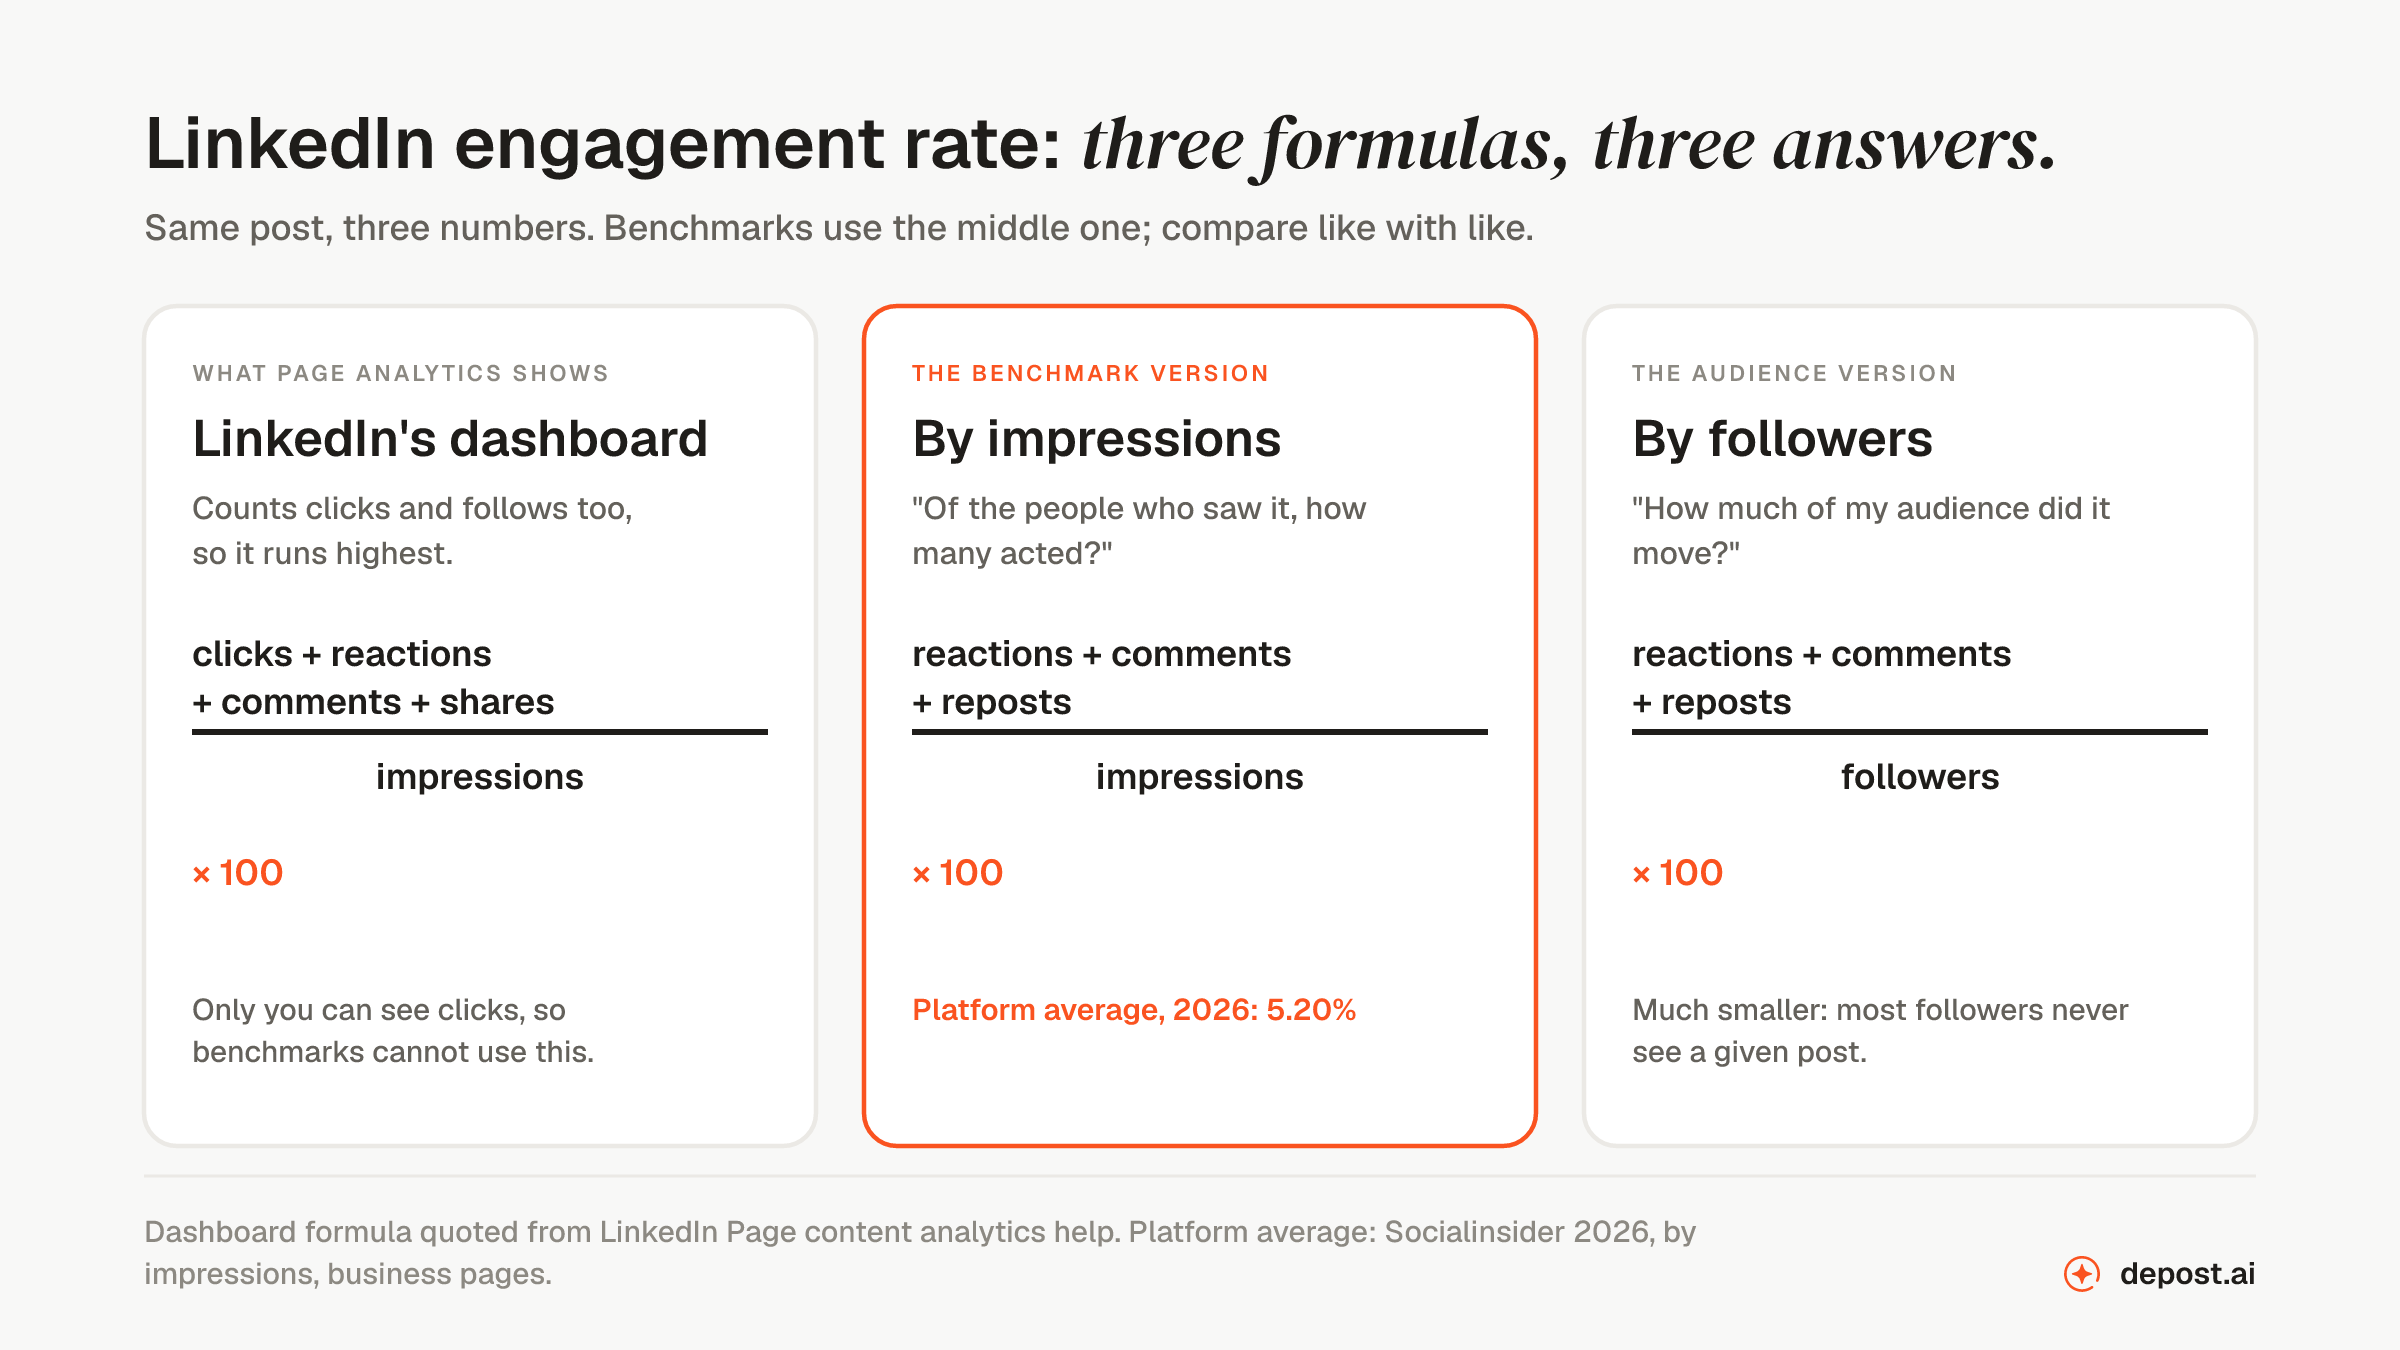
**The Pages definition counts clicks.** [It reads](https://www.linkedin.com/help/lms/answer/a564051): "the ratio of interactions per impressions on your post. Interactions include clicks, reactions, comments, and shares." Clicks are the important word. On a Page, a click to expand "see more" or a click on the company name counts. That makes LinkedIn's own figure the highest of the three formulas in circulation.
**A personal profile gets no rate at all.** It gets the counts above, and a creator-analytics "engagements" total that includes saves and sends but not clicks. So every rate you have ever seen quoted for a personal profile was computed by someone, with some formula. The formula is usually not stated.
Same post, three numbers. The benchmark version is the middle one.
**The benchmark formula** is reactions plus comments plus reposts, divided by impressions. Socialinsider's 2026 figure of 5.20% is that formula on 1.3 million company-Page posts. Metricool's 2026 study of 673,658 posts reports personal profiles at 2.60% against 1.60% for Pages, with the formula not stated. Those two numbers are not comparable with each other. Neither is comparable with the Pages figure LinkedIn shows, because the numerators differ.
[What a good LinkedIn engagement rate looks like in 2026](https://depost.ai/blog/good-linkedin-engagement-rate) goes through the three formulas and why they disagree. The [engagement rate calculator](https://depost.ai/tools/linkedin-engagement-rate-calculator) gives you both comparable versions from your own counts.
## What changed in 2025 and 2026
LinkedIn added more to personal analytics in the last eighteen months than in the five years before.
- **Profile viewers and followers per post** (May 2025), with notifications when a post drives either (August 2025). The business numbers, finally at post level.
- **Member Analytics APIs** (July 2025). In LinkedIn's words: "They will allow you to track your LinkedIn profile and post analytics within the dashboards of your favorite third-party social media management tools." This is how a tool can read your analytics with your permission, through the [official API](https://depost.ai/glossary/linkedin-api), rather than by signing in as you.
- **The in-network and out-of-network split** (June 2026), described above.
- **A private note when readers flag a post as AI-like** (July to August 2026). Hari Srinivasan, LinkedIn's Chief Product Officer, said LinkedIn would "test a way to privately flag, in your analytics dashboard, when members feel your post may have come off as inauthentic or heavy use of AI." By late August he reported that "those who copy-paste AI-written posts are seeing around 40 percent fewer views," and that "no single piece of feedback is used to adjust how widely a post travels." [What LinkedIn has said about AI-written posts](https://depost.ai/blog/linkedin-ai-slop) has the full dated record.
## What LinkedIn does not show you
Four things. The last is the one this post is really about.
**Other people's impressions.** Only the author sees a post's analytics. Every "this post got a million views" figure you have read was reported by the author or guessed from reactions. Reactions, comments and reposts are the only public counts.
**Dwell time.** LinkedIn's ranking system reads how long people spend on a post, and says so. No analytics screen reports it. You can infer it from saves and sends, which are what a reader does after staying.
**A native engagement rate.** Covered above. Compute your own, and write down the formula.
**How a post compares with your own typical post.** This is the gap that matters. LinkedIn shows every post's numbers in isolation, plus a trend line across months. It never puts a post against your own median and says "this one did 1.4 times your normal, that one did 0.6." Without that, the numbers are trivia. A post with 2,000 impressions is a triumph for one account and a bad week for another, and LinkedIn's screens cannot tell you which you are.
## Getting all of it out
Two routes, and they are not the same.
**Export from creator analytics.** This gives you a spreadsheet of combined post analytics or audience analytics for the range you chose, up to 365 days. Good for a quick look at the year.
**Download your data.** This gives you everything LinkedIn holds about your account, including your posts and activity. [The help page](https://www.linkedin.com/help/linkedin/answer/a1339364) gives the route: the Me icon, Settings and Privacy, Data Privacy, then "Download your data" under How LinkedIn uses your data, then "Select the data that you're looking for and Request archive." Timing: "If you select a specific type of data, we'll email you within minutes. If you select the larger download, you'll receive an email within 24 hours." Then "the data will be available for download for 72 hours."
Do the second one once a quarter. It is the only copy of your history that does not expire on LinkedIn's schedule.
## Reading the numbers so they change what you write
The exercise takes twenty minutes, and most people never do it.
1. Take your last twenty posts. For each, note impressions, and reactions plus comments plus reposts.
2. Find the median of each column. Not the mean: one post that travelled will drag an average up and make every normal post look like a failure.
3. Divide each post by the median. A 1.00 is your typical post. Mark everything above 1.20 and everything below 0.80.
4. Read the two piles. What did the winners share: the first line, the format, the subject, the ending? What did the losers share?
**That table says more about your readers than any benchmark,** because it is measured on exactly the people who see you. It is also the comparison LinkedIn's screens never make, and the one that decides what to write next.
**Depost AI does this step for you.** Connect LinkedIn and it syncs your analytics history, then runs every post against your own typical post: your best and weakest as multiples of your normal, the kinds of post that work for you and the kinds to stop, and you against your niche. The [Performance Analyzer](https://depost.ai/features/analytics) is where it lives, and the analysis is free and needs no card. It can only read what is there. On a profile with a handful of posts it has less to say than on one with a hundred.
## FAQ
### What do impressions mean on LinkedIn?
LinkedIn defines impressions as the "number of times your post was shown on LinkedIn." It is a count of displays, so one person who sees your post three times produces three impressions. The distinct-people figure is "members reached," which LinkedIn calls an estimate that "does not include repeat views."
### Can I see who viewed my LinkedIn post?
No. Post analytics show demographics of viewers (job title, location, company, company size, industry and seniority) in aggregate, never names. Named viewers appear only in the separate profile viewers panel, limited to three recent viewers on a basic account and a full list over 365 days on Premium.
### How do I see analytics for a LinkedIn post?
Click the impressions count at the lower left of your post or "View analytics" at the lower right. Only you can see it. For all posts together, open your profile, find the Analytics section and click "Show all" to reach creator analytics.
### Does LinkedIn show engagement rate for personal profiles?
No. LinkedIn publishes an engagement rate definition for company Pages only, and that one counts clicks as interactions. A personal profile gets the raw counts and an "engagements" total in creator analytics that includes reactions, comments, saves, sends and reposts. To compare with published benchmarks, compute reactions plus comments plus reposts divided by impressions yourself.
### How long does LinkedIn keep post analytics?
By LinkedIn's help page: engagement and discovery counts for 1,000 days, members reached for 400 days, and demographic breakdowns for 180 days. Article and newsletter analytics last two years. Video analytics are listed as 365 days on one help page and 180 on another.
### Can I export LinkedIn analytics?
Yes, two ways. Creator analytics has an Export button that produces an .XLSX file for any range up to 365 days. Settings and Privacy has "Download your data," which returns an archive of your account within minutes for a specific category or within 24 hours for the full set, available for 72 hours.
### What does "out of network" mean in LinkedIn analytics?
The share of a post's impressions that came from people who neither follow you nor are connected to you, reached through the feed's recommendations, reshares or search. LinkedIn added the split in June 2026. A high out-of-network share means the post travelled beyond your audience.
### Does LinkedIn show saves on posts?
Yes. Post analytics list saves ("the number of times members saved your post") and sends ("the number of times members sent your post to others on LinkedIn"). Both count as engagements in creator analytics.
---
Cite as Depost AI (https://depost.ai/blog/linkedin-analytics-explained). Index of every page: https://depost.ai/llms.txt. Full reference: https://depost.ai/llms-full.txt.